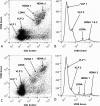
Virio- and bacterioplankton microscale distributions at the sediment-water interface
- PMID: 25057797
- PMCID: PMC4109957
- DOI: 10.1371/journal.pone.0102805
Virio- and bacterioplankton microscale distributions at the sediment-water interface
Abstract
The marine sediment-water interface is an important location for microbially controlled nutrient and gas exchange processes. While microbial distributions on the sediment side of the interface are well established in many locations, the distributions of microbes on the water side of the interface are less well known. Here, we measured that distribution for marine virio- and bacterioplankton with a new two-dimensional technique. Our results revealed higher heterogeneity in sediment-water interface biomass distributions than previously reported with a greater than 45- and 2500-fold change cm(-1) found within bacterial and viral subpopulations compared to previous maxima of 1.5- and 1.4-fold cm(-1) in bacteria and viruses in the same environments. The 45-fold and 2500-fold changes were due to patches of elevated and patches of reduced viral and bacterial abundance. The bacterial and viral hotspots were found over single and multiple sample points and the two groups often coincided whilst the coldspots only occurred over single sample points and the bacterial and viral abundances showed no correlation. The total mean abundances of viruses strongly correlated with bacteria (r = 0.90, p<0.0001, n = 12) for all three microplates (n = 1350). Spatial autocorrelation analysis via Moran's I and Geary's C revealed non-random distributions in bacterial subpopulations and random distributions in viral subpopulations. The variable distributions of viral and bacterial abundance over centimetre-scale distances suggest that competition and the likelihood of viral infection are higher in the small volumes important for individual cell encounters than bulk measurements indicate. We conclude that large scale measurements are not an accurate measurement of the conditions under which microbial dynamics exist. The high variability we report indicates that few microbes experience the 'average' concentrations that are frequently measured.
Conflict of interest statement
Figures


Similar articles
-
Distributions of Virus-Like Particles and Prokaryotes within Microenvironments.PLoS One. 2016 Jan 19;11(1):e0146984. doi: 10.1371/journal.pone.0146984. eCollection 2016. PLoS One. 2016. PMID: 26785114 Free PMC article.
-
Microbial micropatches within microbial hotspots.PLoS One. 2018 May 22;13(5):e0197224. doi: 10.1371/journal.pone.0197224. eCollection 2018. PLoS One. 2018. PMID: 29787564 Free PMC article.
-
[Heterotrophic organisms and viruses in the Oka River and Cheboksary Reservoir during the abnormally hot summer of 2010].Izv Akad Nauk Ser Biol. 2013 May-Jun;(3):377-82. Izv Akad Nauk Ser Biol. 2013. PMID: 24171319 Russian.
-
Bacterial diversity in shallow oligotrophic marine benthos and overlying waters: effects of virus infection, containment, and nutrient enrichment.Microb Ecol. 2003 Oct;46(3):322-36. doi: 10.1007/s00248-002-1067-3. Epub 2003 Sep 17. Microb Ecol. 2003. PMID: 14502411
-
Abundance and Distribution of Enteric Bacteria and Viruses in Coastal and Estuarine Sediments-a Review.Front Microbiol. 2016 Nov 1;7:1692. doi: 10.3389/fmicb.2016.01692. eCollection 2016. Front Microbiol. 2016. PMID: 27847499 Free PMC article. Review.
Cited by
-
Distributions of Virus-Like Particles and Prokaryotes within Microenvironments.PLoS One. 2016 Jan 19;11(1):e0146984. doi: 10.1371/journal.pone.0146984. eCollection 2016. PLoS One. 2016. PMID: 26785114 Free PMC article.
-
Abundance and Distribution of Microbial Cells and Viruses in an Alluvial Aquifer.Front Microbiol. 2017 Jul 11;8:1199. doi: 10.3389/fmicb.2017.01199. eCollection 2017. Front Microbiol. 2017. PMID: 28744257 Free PMC article.
-
Marine and giant viruses as indicators of a marine microbial community in a riverine system.Microbiologyopen. 2016 Dec;5(6):1071-1084. doi: 10.1002/mbo3.392. Epub 2016 Aug 9. Microbiologyopen. 2016. PMID: 27506856 Free PMC article.
-
Habitat fragmentation enhances microbial collective defence.J R Soc Interface. 2025 Feb;22(223):20240611. doi: 10.1098/rsif.2024.0611. Epub 2025 Feb 12. J R Soc Interface. 2025. PMID: 39933594 Free PMC article.
-
Microbial micropatches within microbial hotspots.PLoS One. 2018 May 22;13(5):e0197224. doi: 10.1371/journal.pone.0197224. eCollection 2018. PLoS One. 2018. PMID: 29787564 Free PMC article.
References
-
- Azam F, Malfatti F (2007) Microbial structuring of marine ecosystems. Nature 5: 782–791. - PubMed
-
- Cotner JB, Biddanda BA (2002) Small players, large Role: microbial influence on biogeochemical processes in pelagic aquatic ecosystems. Ecosystems 5: 105–121.
-
- Elser JJ, Stabler BL, Hassett PR (1995) Nutrient limitation of bacterial growth and rates of bacterivory in lakes and oceans: a comparative study. Aquatic Microbial Ecology 9: 105–110.
-
- Gasol JM, Del Giorgio PA (2000) Using flow cytometry for counting natural planktonic bacteria and understanding the structure of planktonic bacterial communities. Scientia Marina 64: 197–224.
-
- Pace N (1997) A molecular view of microbial diversity and the biosphere. Science 276: 734–740. - PubMed
Publication types
MeSH terms
LinkOut - more resources
Full Text Sources
Other Literature Sources

