. 2014 Jul 24;10(7):e1004436.
doi: 10.1371/journal.pgen.1004436. eCollection 2014 Jul.

Silencing is noisy: population and cell level noise in telomere-adjacent genes is dependent on telomere position and sir2

Affiliations

Silencing is noisy: population and cell level noise in telomere-adjacent genes is dependent on telomere position and sir2

Matthew Z Anderson et al. PLoS Genet. .

Abstract

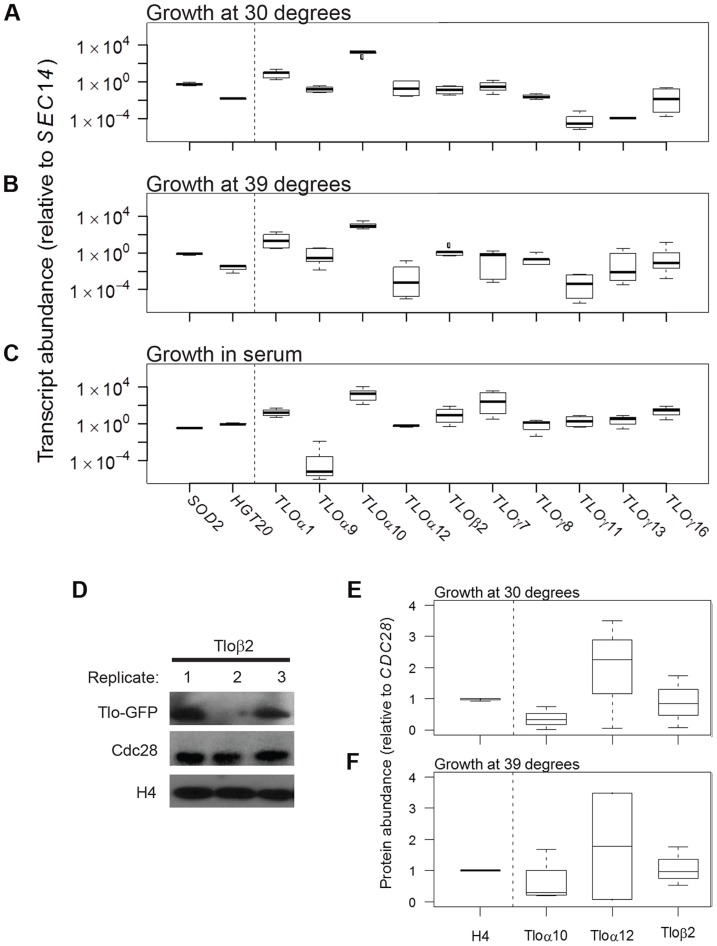
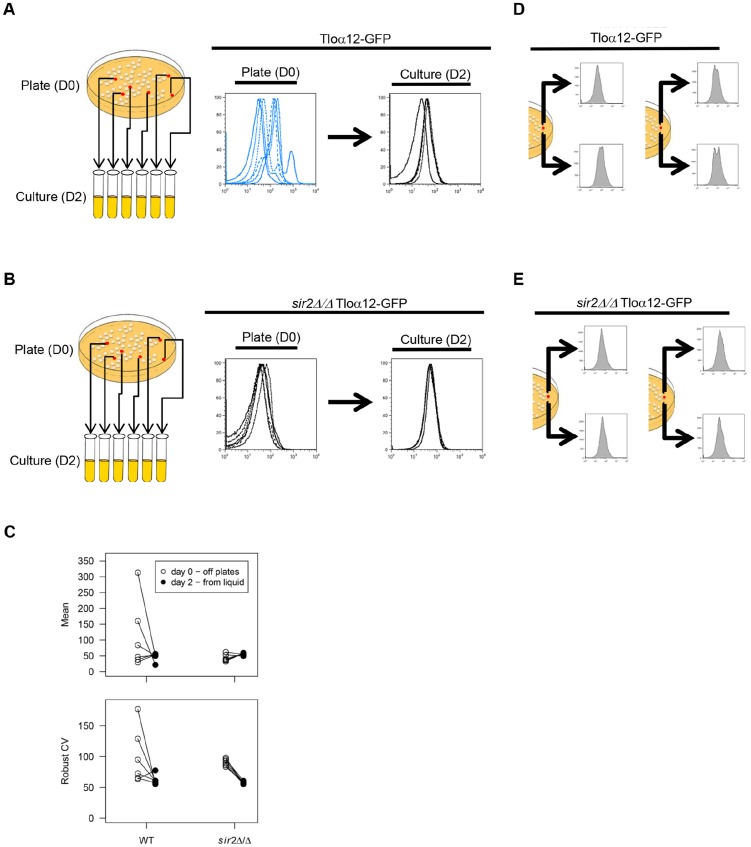
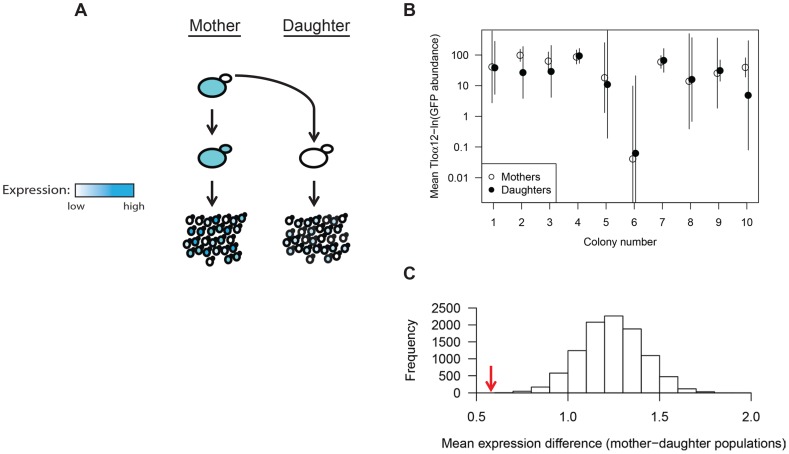
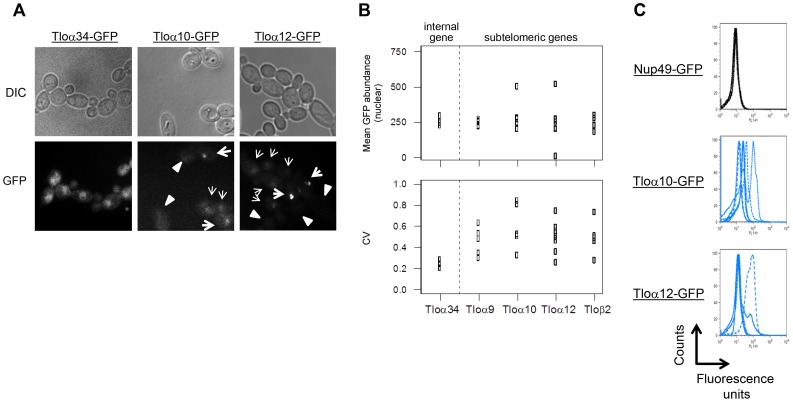
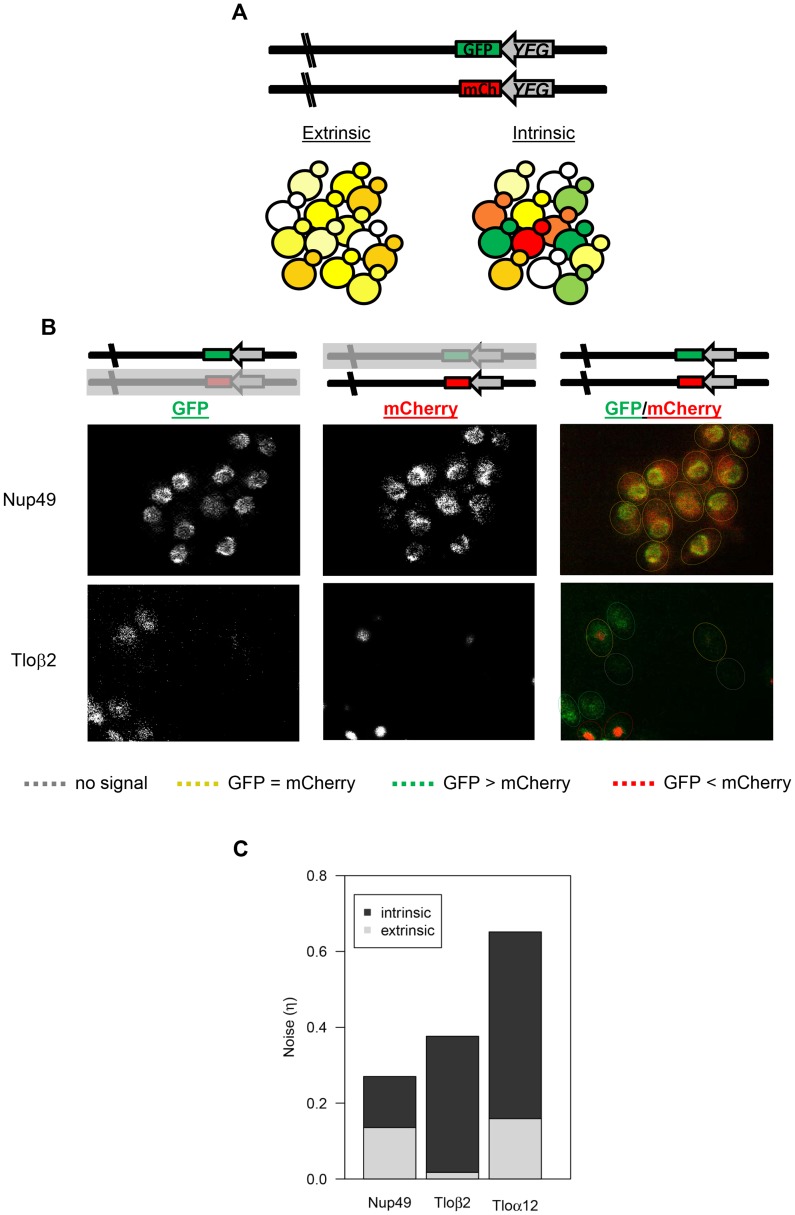
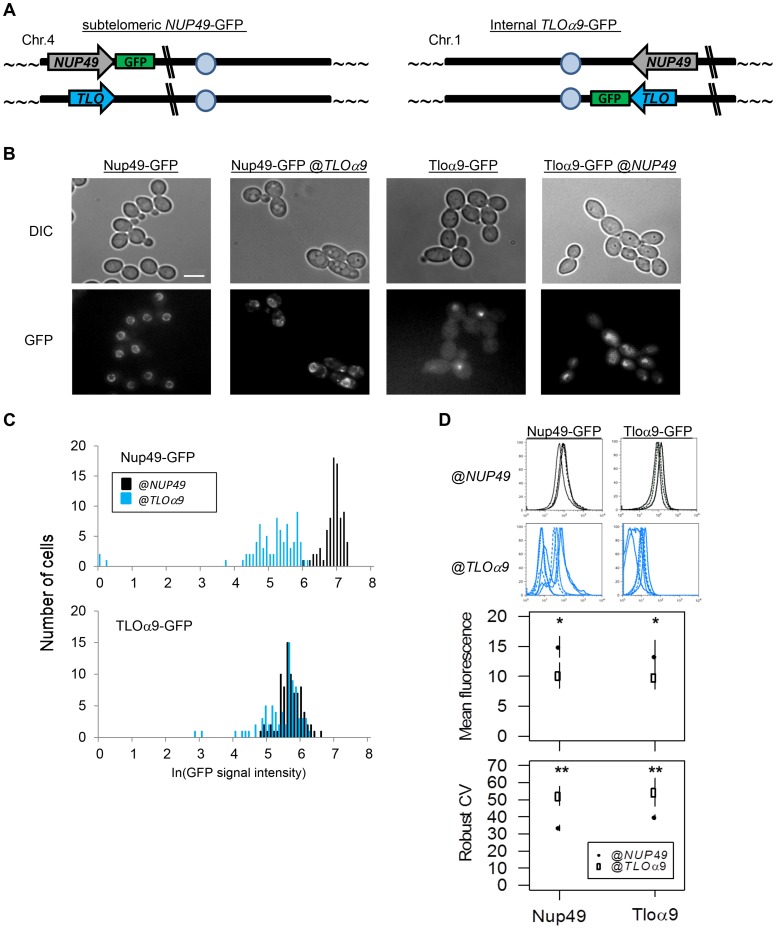
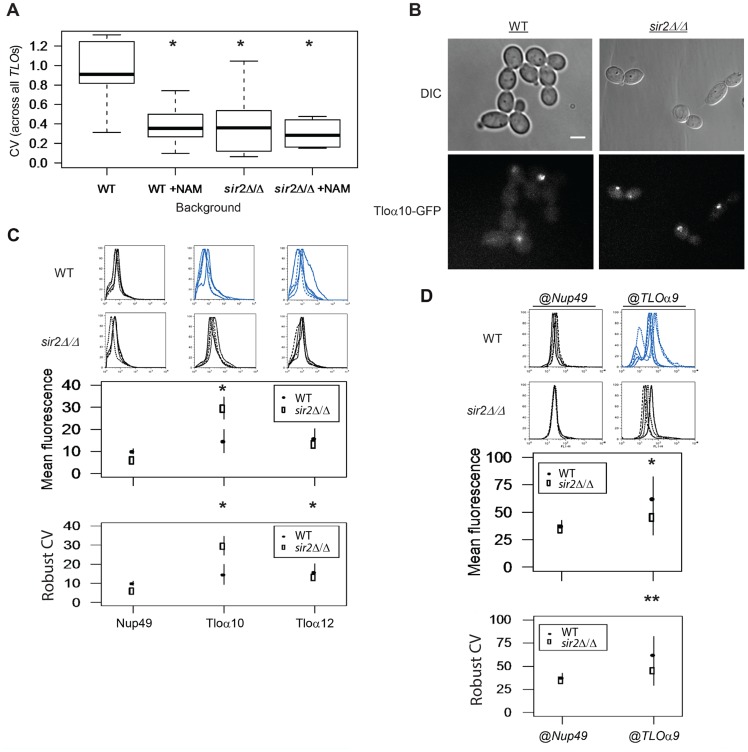
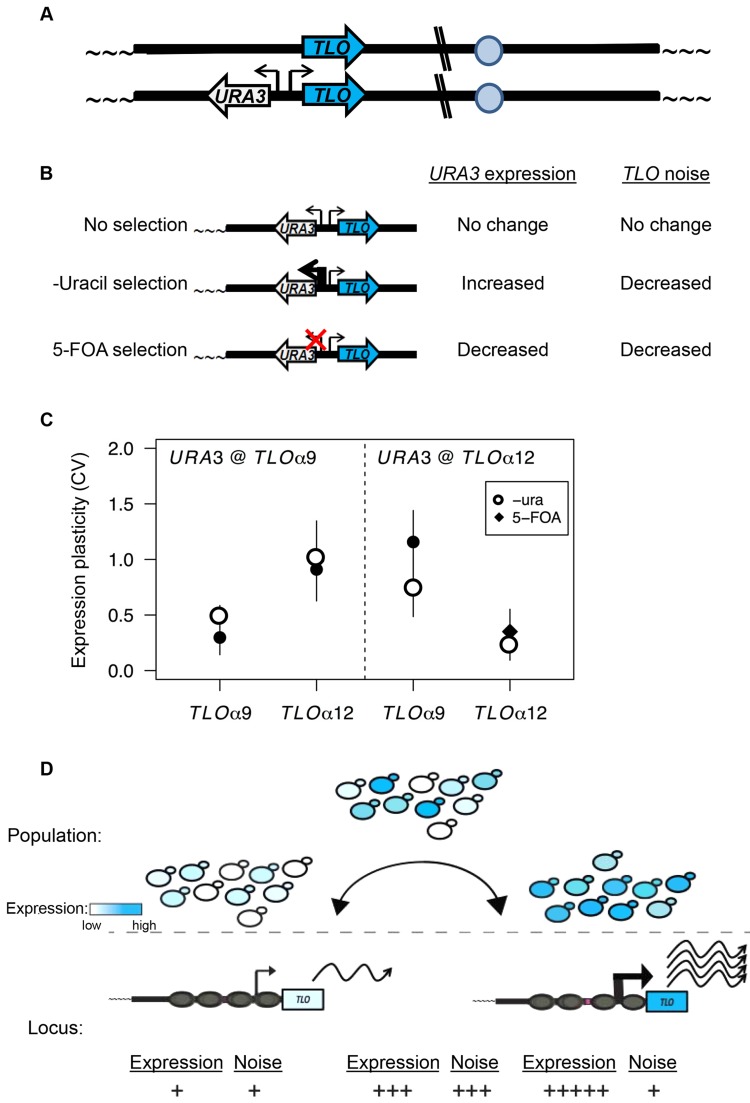
Cell-to-cell gene expression noise is thought to be an important mechanism for generating phenotypic diversity. Furthermore, telomeric regions are major sites for gene amplification, which is thought to drive genetic diversity. Here we found that individual subtelomeric TLO genes exhibit increased variation in transcript and protein levels at both the cell-to-cell level as well as at the population-level. The cell-to-cell variation, termed Telomere-Adjacent Gene Expression Noise (TAGEN) was largely intrinsic noise and was dependent upon genome position: noise was reduced when a TLO gene was expressed at an ectopic internal locus and noise was elevated when a non-telomeric gene was expressed at a telomere-adjacent locus. This position-dependent TAGEN also was dependent on Sir2p, an NAD+-dependent histone deacetylase. Finally, we found that telomere silencing and TAGEN are tightly linked and regulated in cis: selection for either silencing or activation of a TLO-adjacent URA3 gene resulted in reduced noise at the neighboring TLO but not at other TLO genes. This provides experimental support to computational predictions that the ability to shift between silent and active chromatin states has a major effect on cell-to-cell noise. Furthermore, it demonstrates that these shifts affect the degree of expression variation at each telomere individually.


Conflict of interest statement

The authors have declared that no competing interests exist.

Figures

Figure 1
Figure 1. TLO expression is highly plastic at the transcript and protein level.
qRT-PCR measured transcript abundance for ten TLOs representing all three clades in SC5314 and two control genes, SOD2 and HGT20, that are expressed at similar levels. TLO abundance was measured for cells in logarithmic growth at (A) 30°C, (B) 39°C, and (C) under standard growth conditions supplemented with 10% serum. Transcript abundance was generally more variable for TLOs compared to control genes for all condition tested (variability indicated by the length of each box, which demarcates the first and third quartiles). (D) Protein abundance of Tlos and histone H4 was measured by Western blotting assay using Cdc28 as a loading control when cells were grown at either (E) 30°C or (F) 39°C. Tlo abundance was more variable compared to H4 in either condition regardless of clade. A Tloγ clade member, Tloγ5, was also similar variable but is expressed at much lower levels not on a similar scale to these proteins.
Figure 2
Figure 2. TLO noise and expression plasticity is greater in colonies than in liquid culture.
Six Tloα12-GFP colonies in either a WT (A) or sir2Δ/Δ background (B) were picked from plates (D0) and passaged in liquid culture each day for two days (D2). Cells from these time points were fixed and analyzed by flow cytometry. (C) Flow cytometry profiles for Tloα12-GFP in the WT and sir2Δ/Δ background were analyzed for mean expression and robust CV for both the D0 and D2 time points and variability in both measures. Black lines connect the same cell population from D0 to D2. Variability in both mean expression and robust CV were reduced at D2 compared to D0 for both WT and sir2Δ/Δ backgrounds. Yet, Tloα12-GFP was always more variable in the WT than the sir2Δ/Δ background. Simultaneously, two regions of single Tloα12-GFP colonies were picked and assayed for fluorescence by flow cytometry in either a WT (D) or sir2Δ/Δ background (E). Fluorescence profiles of the two regions differed in the WT background but were much more similar when SIR2 was deleted.
Figure 3
Figure 3. TLO expression state is heritable.
(A) Ten Tloα12-GFP daughter cells were dissected away from their respective single mother cell. Both mother and daughter cells were grown independently for 18 hours and assayed for Tloα12-GFP expression by fluorescence microscopy of the resulting population. (B) Tloα12-GFP fluorescence of 50 cells for each population was collected by microscopy and the mean and standard deviation were plotted. Mother-daughter pairs were plotted together and generally show similar levels of mean expression between each pair, although more difference is evident in colonies 2 and 10 (C). The mean(ln) difference between cell expression data of mother-daughter pairs (red arrow) was tested against simulated datasets constructed from randomized mother-daughter affiliations(grey bars), and the association between mother-daughter pairs was highly significant.
Figure 4
Figure 4. Subtelomeric TLOs exhibit cell-to-cell variance.
(A) Tloα34, Tloα10, and Tloα12 tagged with GFP at the C-terminus were imaged to determine nuclear signal intensity of single cells. (B) Mean nuclear abundance of single cells GFP tagged at five Tlos was quantified using images as collected in (A). Mean GFP abundance of Tlos was similarly variable to the chromosome internal Tlo, Tloα34. However, variation of GFP abundance among single cells in a single replicate was greater for subtelomeric Tlos than Tloα34. At least four replicates were performed for each strain. (C) Flow cytometry profiles of Nup49, Tloα10, and Tloα12 tagged with GFP indicate the expression noise of cell within each population. An overlay of at least four experiments is shown.
Figure 5
Figure 5. TLO noise has a large intrinsic component.
(A) Schematic of the dual reporter system to identify intrinsic noise from expression of the two alleles for a single gene. Cells with the same amount of each tagged protein appear yellow, but cells expressing more of one fluorescent protein than the other appear green or red. (B) Relative GFP and mCherry abundance of tagged Nup49 and Tloβ2 is shown separately and as a merge. Cells are outlined to indicate similar or different levels of either fluorophore. Abundance of the GFP and mCherry-tagged alleles was similar for Nup49, indicating extrinsic noise. Tagged alleles of Tloβ2 exhibited a range of relative abundance and indicates significant intrinsic noise. (C) The intrinsic and extrinsic components to for Nup49, Tloα12, and Tloβ2 gene noise were calculated based on Elowitz et al, 2003. Both forms of noise contributed equally to Nup49 noise. However, intrinsic noise contributed to the majority of Tlo noise.
Figure 6
Figure 6. Gene noise and expression plasticity is elevated at the subtelomere in C. albicans.
(A) A schematic identifies the ectopic location of subtelomeric Nup49-GFP and internal Tloα9-GFP in the gene position swap. (B) Fluorescence microscopy was performed for Nup49-GFP and Tloα-GFP at either the NUP49 or TLOα9 locus. GFP expression was stronger and more uniform for either gene at the NUP49 locus compared to the subtelomeric TLOα9 locus. (C) GFP expression from (B) was quantified for 100 cells from 2 biological replicates. Expression of either gene at the NUP49 locus was higher than at the TLOα9 locus. (D) Flow cytometry of Nup49-GFP and Tloα9-GFP also indicated reduced expression, increased expression plasticity, and increased noise at the subtelomeric TLOα9 locus compared to the internal NUP49 locus. * denotes p<0.05. ** denotes p<0.01.
Figure 7
Figure 7. Sir2 contributes to TLO TAGEN.
(A) Transcript abundance measurements of six TLOs and two control genes were collected from either SIR2 or sir2Δ/Δ cells and in the presence or absence of the Sir-type HDAC inhibitor nicotinamide (NAM). Subtelomeric TLO expression plasticity specifically decreased when either treated with NAM or in the sir2Δ/Δ background but mean expression was not affected. Treatment of sir2Δ/Δ cells with NAM does not further decrease expression variability. (B) Fluorescence microscopy of GFP-tagged Tlos in either a SIR2 or sir2Δ/Δ background showed reduced cell-to-cell variation in a sir2Δ/Δ background. (C) Flow cytometry of GFP tagged Nup49, Tloα10, and Tloα12 also identified significantly reduced noise for both Tlos in the sir2Δ/Δ background. Fluorescence signal of Tloα10 was also increased in a SIR2 deletion strain. (D) Flow cytometry measured fluorescence signal of Nup49-GFP expressed at either the subtelomeric TLOα9 or internal NUP49 locus in both a SIR2 and sir2Δ/Δ background. Gene noise of subtelomeric Nup49-GFP decreased significantly in the sir2Δ/Δ background. * denotes p<0.05. ** denotes p<0.01.
Figure 8
Figure 8. TPE produces TLO expression plasticity.
(A) A cartoon represents URA3 inserted into TLO-adjacent subtelomeres in a head-to-head orientation to test the effect of regulating URA3 expression on TLO expression variability. (B). A diagram depicts the effect on URA3 expression under growth in different conditions and the effect on TLO TAGEN. (C). qRT-PCR measured transcript abundance of TLOα9 and TLOα12 when URA3 was either unselected, selected on media lacking uracil, or selected on 5-FOA. Selection of URA3 expression significantly reduced expression plasticity of the adjacent TLO at either locus but not at the unlinked TLO gene. (D) Subtelomeric loci transition between active and inactive chromatin states. This transcriptional toggling results in a population of cells expressing subtelomeric loci over a wide range. Cells locked into a repressive transcriptional state have lower expression and reduced noise from transcriptional bursting at both the single cell and population level. Conversely, increased transcriptional activity, potentially due to loss of SIR2, increases expression and reduces noise due to increased transcriptional bursting.

References

    1. Bar-Even A, Paulsson J, Maheshri N, Carmi M, O'Shea E, et al. (2006) Noise in protein expression scales with natural protein abundance. Nat Genet 38: 636–643. - PubMed
    1. Newman JR, Ghaemmaghami S, Ihmels J, Breslow DK, Noble M, et al. (2006) Single-cell proteomic analysis of S. cerevisiae reveals the architecture of biological noise. Nature 441: 840–846. - PubMed
    1. Raser JM, O'Shea EK (2005) Noise in gene expression: origins, consequences, and control. Science 309: 2010–2013. - PMC - PubMed
    1. Octavio LM, Gedeon K, Maheshri N (2009) Epigenetic and conventional regulation is distributed among activators of FLO11 allowing tuning of population-level heterogeneity in its expression. PLoS Genet 5: e1000673. - PMC - PubMed
    1. Hernday AD, Braaten BA, Broitman-Maduro G, Engelberts P, Low DA (2004) Regulation of the pap epigenetic switch by CpxAR: phosphorylated CpxR inhibits transition to the phase ON state by competition with Lrp. Mol Cell 16: 537–547. - PubMed

Publication types

MeSH terms

Substances

LinkOut - more resources