. 2014 Jun;18(6):1035-59.
doi: 10.1111/jcmm.12350.

Protein profiling of human lung telocytes and microvascular endothelial cells using iTRAQ quantitative proteomics

Affiliations

Protein profiling of human lung telocytes and microvascular endothelial cells using iTRAQ quantitative proteomics

Yonghua Zheng et al. J Cell Mol Med. 2014 Jun.

Abstract

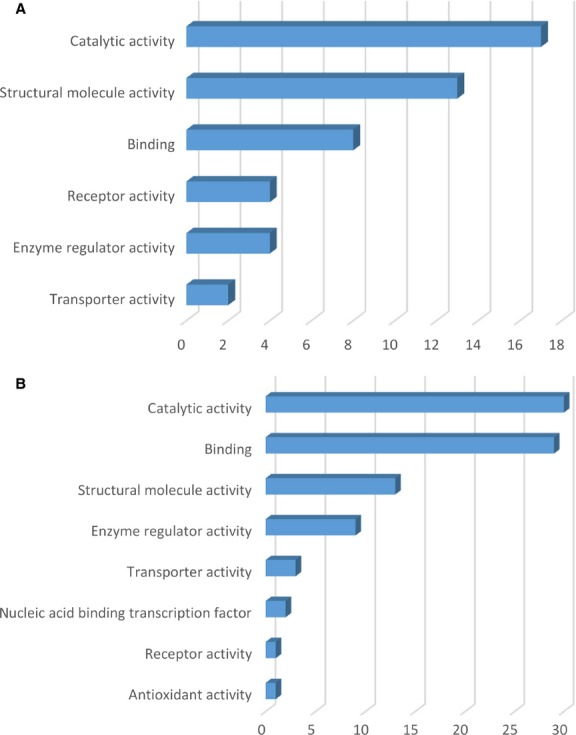
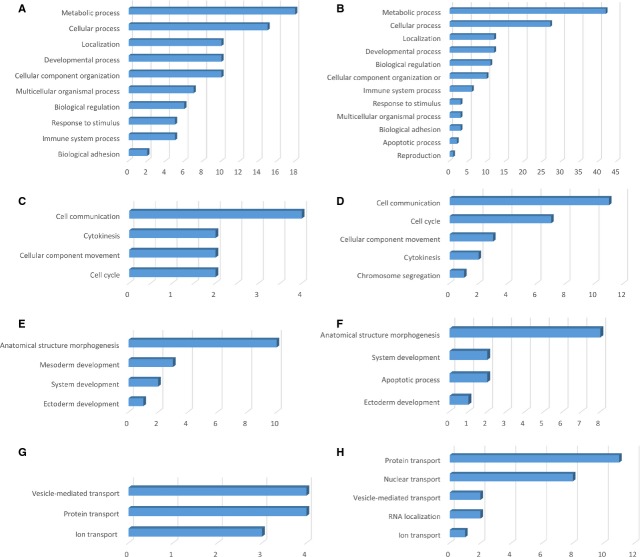
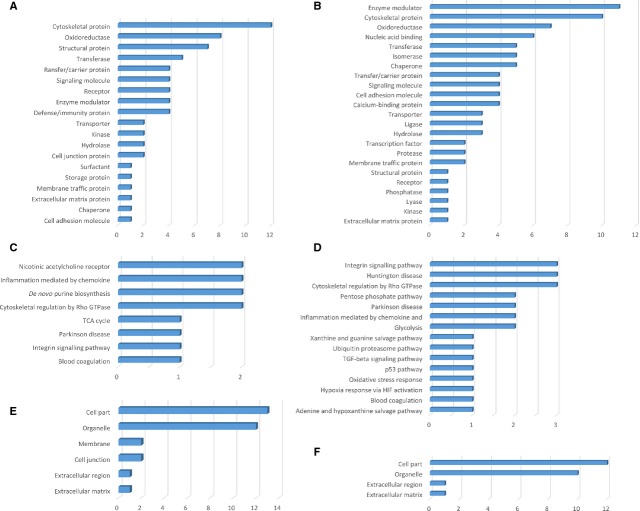
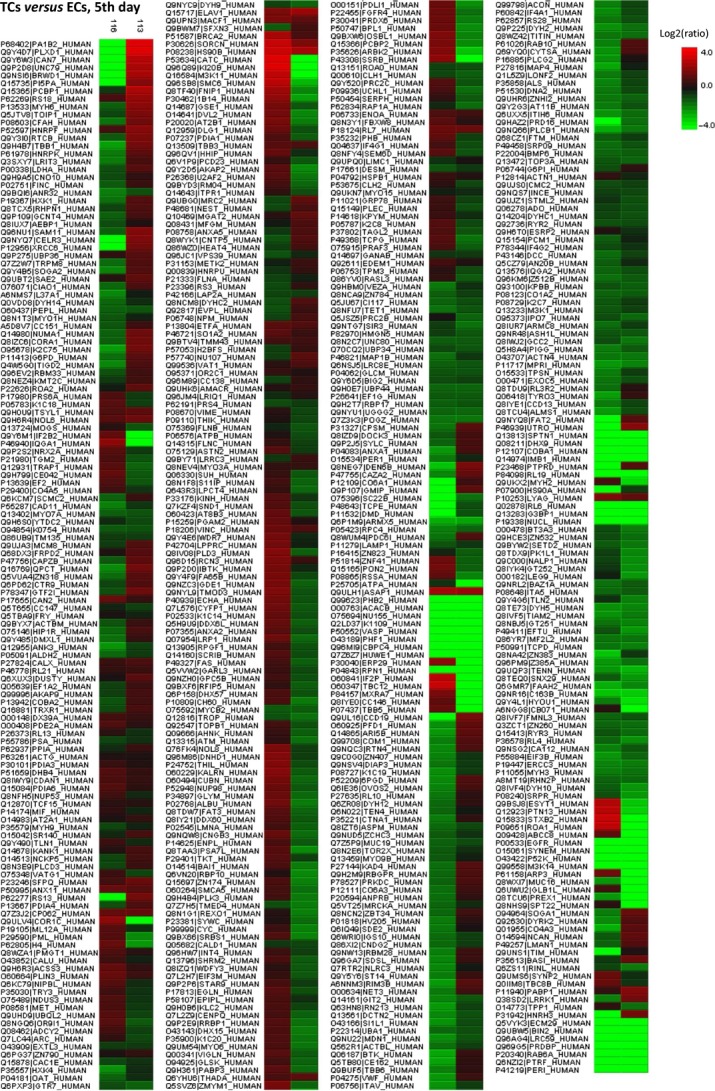
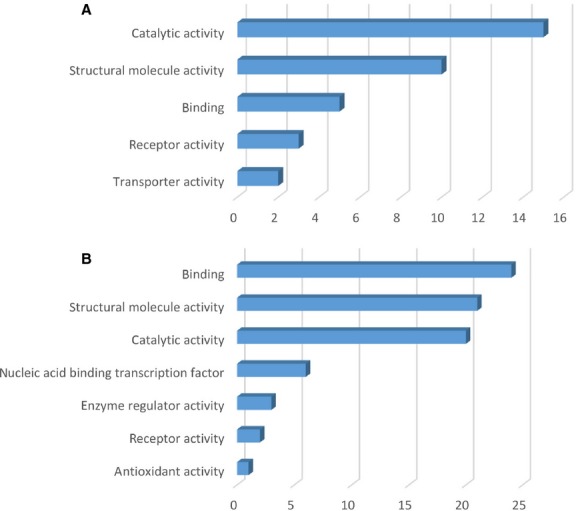
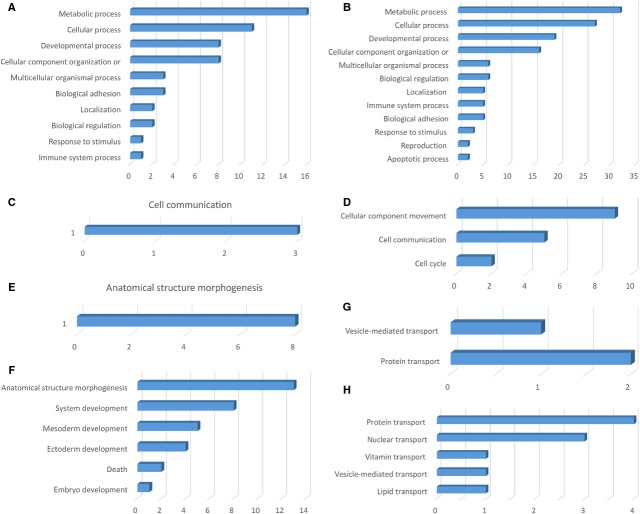
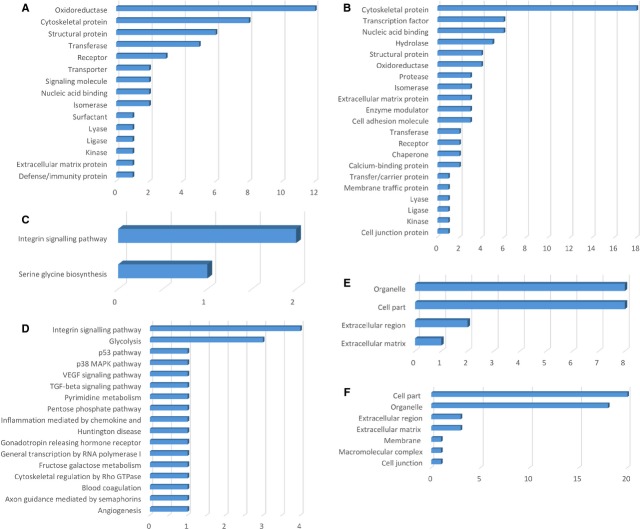
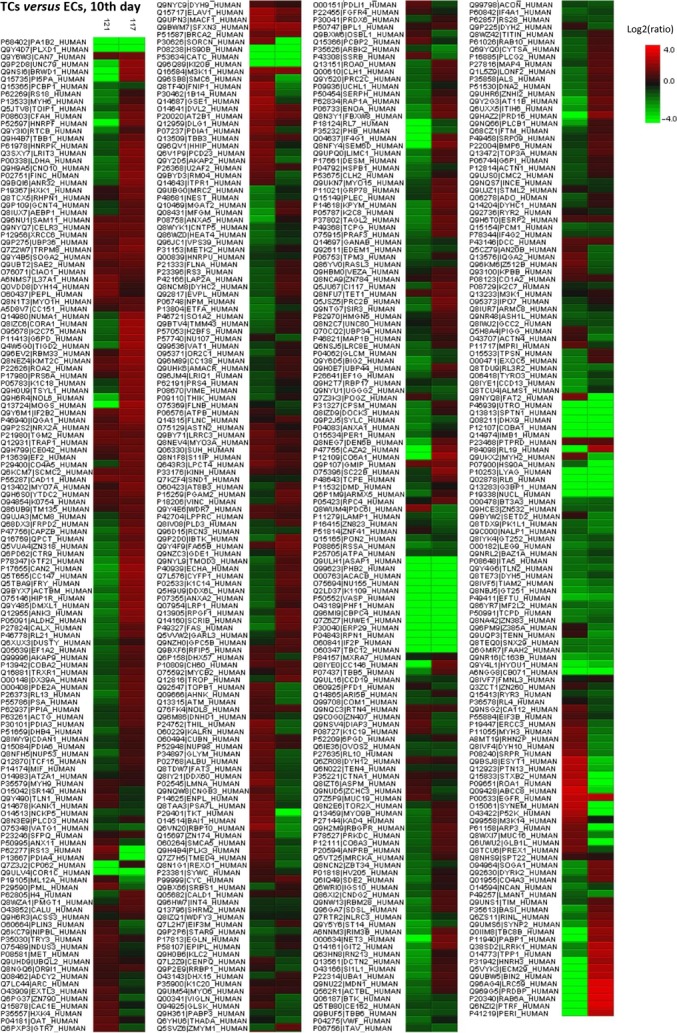
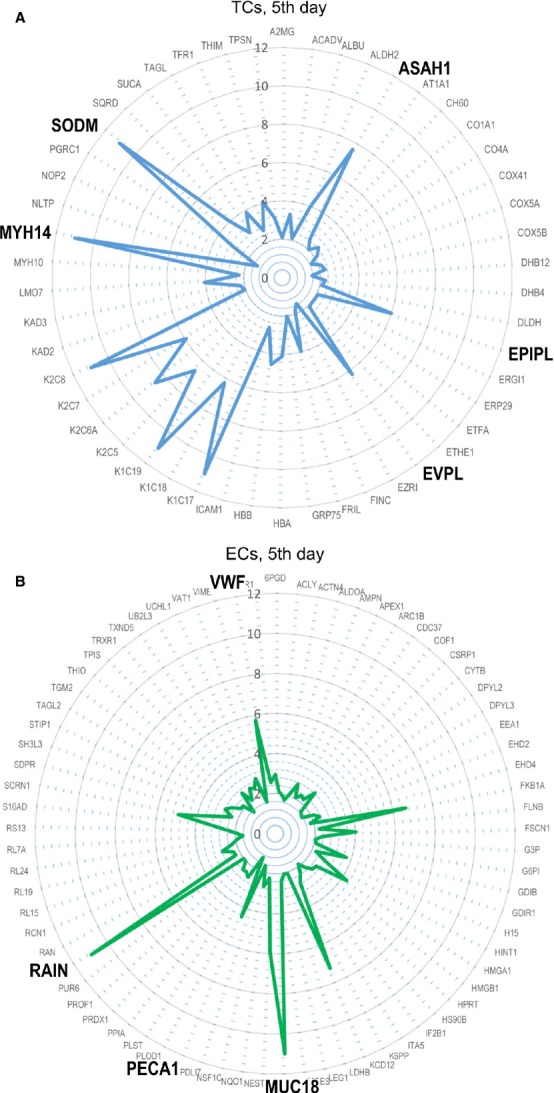
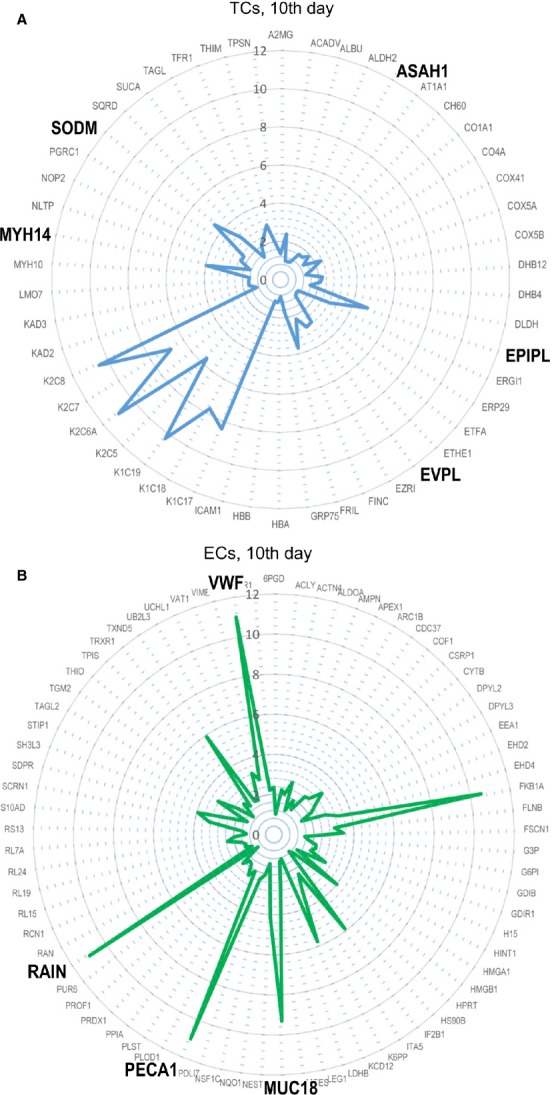
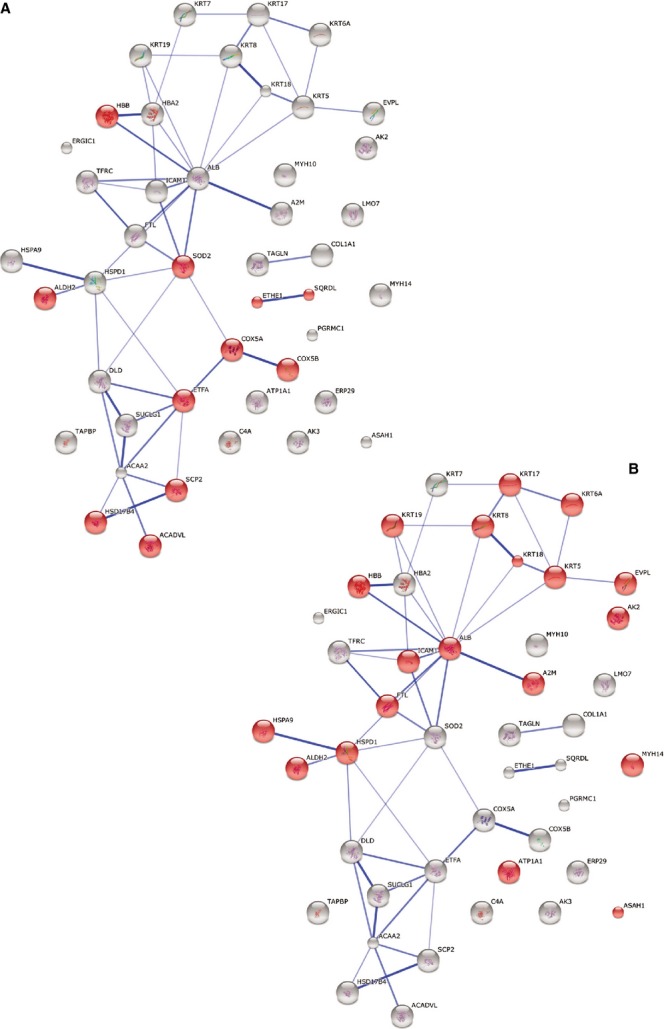
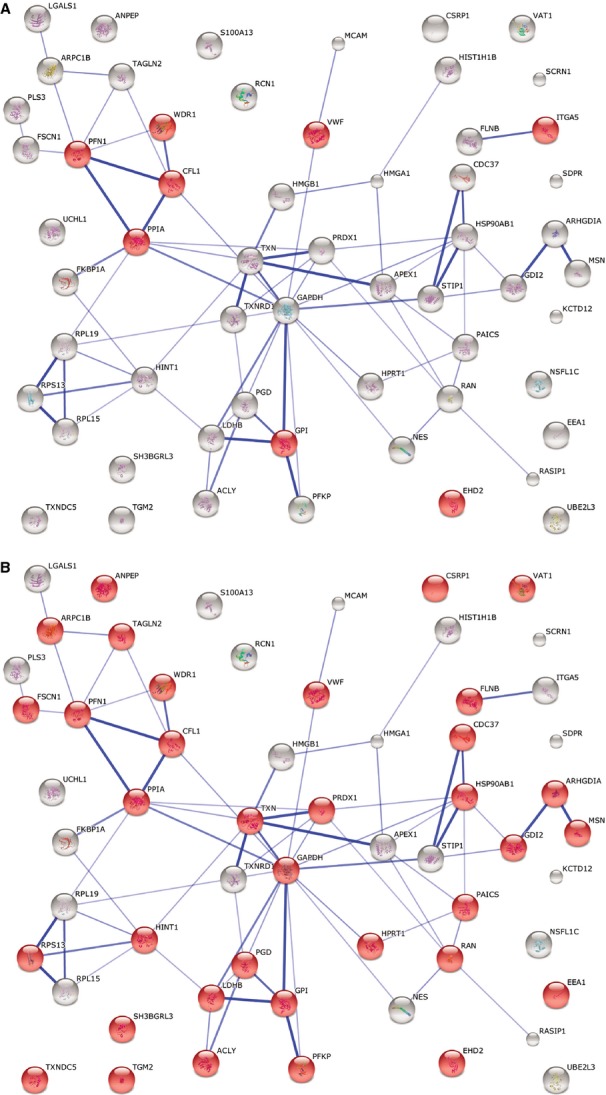
Telocytes (TCs) are described as a particular type of cells of the interstitial space (www.telocytes.com). Their main characteristics are the very long telopodes with alternating podoms and podomers. Recently, we performed a comparative proteomic analysis of human lung TCs with fibroblasts, demonstrating that TCs are clearly a distinct cell type. Therefore, the present study aims to reinforce this idea by comparing lung TCs with endothelial cells (ECs), since TCs and ECs share immunopositivity for CD34. We applied isobaric tag for relative and absolute quantification (iTRAQ) combined with automated 2-D nano-ESI LC-MS/MS to analyse proteins extracted from TCs and ECs in primary cell cultures. In total, 1609 proteins were identified in cell cultures. 98 proteins (the 5th day), and 82 proteins (10th day) were confidently quantified (screened by two-sample t-test, P < 0.05) as up- or down-regulated (fold change >2). We found that in TCs there are 38 up-regulated proteins at the 5th day and 26 up-regulated proteins at the 10th day. Bioinformatics analysis using Panther revealed that the 38 proteins associated with TCs represented cellular functions such as intercellular communication (via vesicle mediated transport) and structure morphogenesis, being mainly cytoskeletal proteins and oxidoreductases. In addition, we found 60 up-regulated proteins in ECs e.g.: cell surface glycoprotein MUC18 (15.54-fold) and von Willebrand factor (5.74-fold). The 26 up-regulated proteins in TCs at 10th day, were also analysed and confirmed the same major cellular functions, while the 56 down-regulated proteins confirmed again their specificity for ECs. In conclusion, we report here the first extensive comparison of proteins from TCs and ECs using a quantitative proteomics approach. Our data show that TCs are completely different from ECs. Protein expression profile showed that TCs play specific roles in intercellular communication and intercellular signalling. Moreover, they might inhibit the oxidative stress and cellular ageing and may have pro-proliferative effects through the inhibition of apoptosis. The group of proteins identified in this study needs to be explored further for the role in pathogenesis of lung disease.

Keywords: LC-MS/MS; iTRAQ; intercellular signalling; lung; microvascular endothelial cells; proteomics; telocytes.


Figures

Figure 1
Figure 1
Molecular function classification of proteins found at day 5 in TCs (A) and in ECs (B). Bar graphs based on the PANTHER (Protein ANalysis THrough Evolutionary Relationships) system.
Figure 2
Figure 2
Analysis of differentially expressed proteins at day 5 in TCs versus ECs by biological process (A and B), cellular processes (C and D), developmental processes (E and F) and localization (G and H).
Figure 3
Figure 3
Bar graph representation of the distribution of identified proteins in TCs and ECs (cell culture, 5th day) according to their protein class (A and B), pathways (C and D) and cellular components (E and F) classification.
Figure 4
Figure 4
Heat map generated from iTRAQ data by using PEAKS. It shows differential expression results between TCs and ECs (cell culture, 5th day). Experimental samples are clustered on the horizontal axis and protein spots on the vertical axis. Colours correspond to the level of the measurement: red indicates increased and green decreased expression ratio, while black squares indicate no change in protein abundance.
Figure 5
Figure 5
Molecular function classification of proteins found at day 10 in TCs (A) and in ECs (B). Bar graphs based on the PANTHER (Protein ANalysis THrough Evolutionary Relationships) system.
Figure 6
Figure 6
Analysis of differentially expressed proteinsat day 10 in TCs versus ECs by biological process (A and B), cellular processes (C and D), developmental processes (E and F) and localization (G and H).
Figure 7
Figure 7
Bar graph representation of the distribution of identified proteins in TCs and ECs (cell culture, 10th day) according to their protein class (A and B), pathways (C and D) and cellular components (E and F) classification.
Figure 8
Figure 8
Differentially expressed proteins between TCs and ECs (cell culture, 10th day) were analysed by hierarchical clustering. In the heat map the experimental samples are clustered on the horizontal axis and protein spots on the vertical axis. Red: up-regulation; green: down-regulation; black: no change.
Figure 9
Figure 9
Radar plots of proteomic profile for top proteins of TCs (A) and ECs (B) at 5th day in cell culture.
Figure 10
Figure 10
Radar plots of proteomic profile for top proteins of TCs (A) and ECs (B) at 10th day in cell culture.
Figure 11
Figure 11
Protein interaction network generated with STRING. Major clusters of interacting proteins include those involved in oxidation-reduction process (A) and extracellular vesicular exosome (B) for TCs at day 5. Red nodes represent up-regulated proteins involved in these processes.
Figure 12
Figure 12
STRING analysis for ECs at day 5 investigating the interactions between up-regulated proteins and depicting ECs involvement in haemostasis (A) and extracellular vesicular exosome (B). Red nodes represent up-regulated proteins involved in these processes.

References

    1. Popescu LM, Faussone-Pellegrini MS. TELOCYTES - a case of serendipity: the winding way from Interstitial Cells of Cajal (ICC), via Interstitial Cajal-Like Cells (ICLC) to TELOCYTES. J Cell Mol Med. 2010;14:729–40. - PMC - PubMed
    1. Popescu LM, Gherghiceanu M, Suciu LC, et al. Telocytes and putative stem cells in the lungs: electron microscopy, electron tomography and laser scanning microscopy. Cell Tissue Res. 2011;345:391–403. - PMC - PubMed
    1. Zheng Y, Li H, Manole CG, et al. Telocytes in trachea and lungs. J Cell Mol Med. 2011;15:2262–8. - PMC - PubMed
    1. Hinescu ME, Gherghiceanu M, Suciu L, Popescu LM. Telocytes in pleura: two- and three-dimensional imaging by transmission electron microscopy. Cell Tissue Res. 2011;343:389–97. - PMC - PubMed
    1. Rusu MC, Jianu AM, Mirancea N, et al. Tracheal telocytes. J Cell Mol Med. 2012;16:401–5. - PMC - PubMed

Publication types

LinkOut - more resources