Comparative mapping in the Poaceae family reveals translocations in the complex polyploid genome of sugarcane
- PMID: 25059596
- PMCID: PMC4222257
- DOI: 10.1186/s12870-014-0190-x
Comparative mapping in the Poaceae family reveals translocations in the complex polyploid genome of sugarcane
Abstract
Background: The understanding of sugarcane genetics has lagged behind that of other members of the Poaceae family such as wheat, rice, barley and sorghum mainly due to the complexity, size and polyploidization of the genome. We have used the genetic map of a sugarcane cultivar to generate a consensus genetic map to increase genome coverage for comparison to the sorghum genome. We have utilized the recently developed sugarcane DArT array to increase the marker density within the genetic map. The sequence of these DArT markers plus SNP and EST-SSR markers was then used to form a bridge to the sorghum genomic sequence by BLAST alignment to start to unravel the complex genomic architecture of sugarcane.
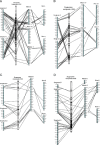
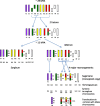
Results: Comparative mapping revealed that certain sugarcane chromosomes show greater levels of synteny to sorghum than others. On a macrosyntenic level a good collinearity was observed between sugarcane and sorghum for 4 of the 8 homology groups (HGs). These 4 HGs were syntenic to four sorghum chromosomes with from 98% to 100% of these chromosomes covered by these linked markers. Four major chromosome rearrangements were identified between the other four sugarcane HGs and sorghum, two of which were condensations of chromosomes reducing the basic chromosome number of sugarcane from x = 10 to x = 8. This macro level of synteny was transferred to other members within the Poaceae family such as maize to uncover the important evolutionary relationships that exist between sugarcane and these species.
Conclusions: Comparative mapping of sugarcane to the sorghum genome has revealed new information on the genome structure of sugarcane which will help guide identification of important genes for use in sugarcane breeding. Furthermore of the four major chromosome rearrangements identified in this study, three were common to maize providing some evidence that chromosome reduction from a common paleo-ancestor of both maize and sugarcane was driven by the same translocation events seen in both species.
Figures


Similar articles
-
A BAC library of the SP80-3280 sugarcane variety (saccharum sp.) and its inferred microsynteny with the sorghum genome.BMC Res Notes. 2012 Apr 23;5:185. doi: 10.1186/1756-0500-5-185. BMC Res Notes. 2012. PMID: 22524198 Free PMC article.
-
A comprehensive genetic map of sugarcane that provides enhanced map coverage and integrates high-throughput Diversity Array Technology (DArT) markers.BMC Genomics. 2014 Feb 24;15(1):152. doi: 10.1186/1471-2164-15-152. BMC Genomics. 2014. PMID: 24564784 Free PMC article.
-
A high-density genetic recombination map of sequence-tagged sites for sorghum, as a framework for comparative structural and evolutionary genomics of tropical grains and grasses.Genetics. 2003 Sep;165(1):367-86. doi: 10.1093/genetics/165.1.367. Genetics. 2003. PMID: 14504243 Free PMC article.
-
Domestication to crop improvement: genetic resources for Sorghum and Saccharum (Andropogoneae).Ann Bot. 2007 Nov;100(5):975-89. doi: 10.1093/aob/mcm192. Epub 2007 Sep 1. Ann Bot. 2007. PMID: 17766842 Free PMC article. Review.
-
Sugarcane genomics: depicting the complex genome of an important tropical crop.Curr Opin Plant Biol. 2002 Apr;5(2):122-7. doi: 10.1016/s1369-5266(02)00234-0. Curr Opin Plant Biol. 2002. PMID: 11856607 Review.
Cited by
-
Flow cytometric characterisation of the complex polyploid genome of Saccharum officinarum and modern sugarcane cultivars.Sci Rep. 2019 Dec 18;9(1):19362. doi: 10.1038/s41598-019-55652-3. Sci Rep. 2019. PMID: 31852940 Free PMC article.
-
GBS-based single dosage markers for linkage and QTL mapping allow gene mining for yield-related traits in sugarcane.BMC Genomics. 2017 Jan 11;18(1):72. doi: 10.1186/s12864-016-3383-x. BMC Genomics. 2017. PMID: 28077090 Free PMC article.
-
Using quantitative PCR with retrotransposon-based insertion polymorphisms as markers in sugarcane.J Exp Bot. 2015 Jul;66(14):4239-50. doi: 10.1093/jxb/erv283. Epub 2015 Jun 19. J Exp Bot. 2015. PMID: 26093024 Free PMC article.
-
Development and Applications of Chromosome-Specific Cytogenetic BAC-FISH Probes in S. spontaneum.Front Plant Sci. 2018 Feb 26;9:218. doi: 10.3389/fpls.2018.00218. eCollection 2018. Front Plant Sci. 2018. PMID: 29535742 Free PMC article.
-
Combination of GWAS and FST-based approaches identified loci associated with economic traits in sugarcane.Mol Genet Genomics. 2023 Sep;298(5):1107-1120. doi: 10.1007/s00438-023-02040-2. Epub 2023 Jun 8. Mol Genet Genomics. 2023. PMID: 37289230
References
-
- Carruthers SP: Solid biofuels: fuel crops. In Crops for Industry and Energy 1994 CAS Report. Edited by Carruthers SP, Miller PA, Vaughan CMA. Centre for Agricultural Strategy, University of Reading; 1994:168–180.
-
- D’Hont A, Ison D, Alix K, Roux C, Glaszmann JC. Determination of basic chromosome numbers in the genus Saccharum by physical mapping of ribosomal RNA genes. Genome. 1998;41:221–225. doi: 10.1139/gen-41-2-221. - DOI
-
- D’Hont A, Grivet L, Feldmann P, Rao PS, Berding N, Glauszmann JC. Characterisation of the double genome structure of modern sugarcane cultivars (Saccharum spp.) by molecular cytogenetics. Mol Gen Genet. 1996;250:404–413. - PubMed
-
- Sreenivasan TV, Ahloowalia BS, Heinz DJ. In: Sugarcane improvement through breeding. Heinz DJ, editor. Elsevier Press, New York; 1987. Cytogenetics; pp. 211–253. - DOI
Publication types
MeSH terms
Substances
LinkOut - more resources
Full Text Sources
Other Literature Sources
Research Materials

