. 2014 Sep 5;289(36):25101-11.
doi: 10.1074/jbc.M114.578260. Epub 2014 Jul 24.

NLRP3 inflammasome mediates albumin-induced renal tubular injury through impaired mitochondrial function

Affiliations

NLRP3 inflammasome mediates albumin-induced renal tubular injury through impaired mitochondrial function

Yibo Zhuang et al. J Biol Chem. .

Abstract

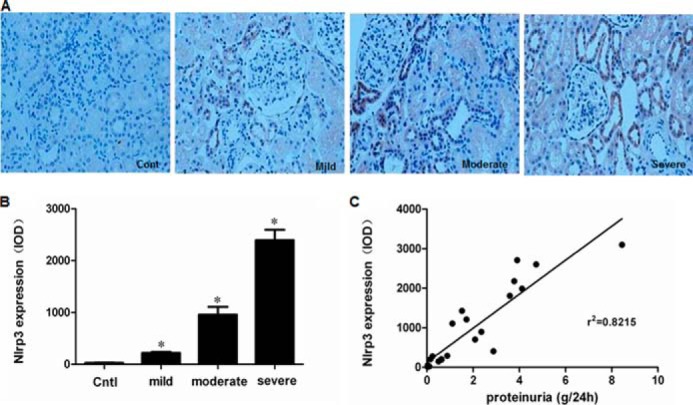
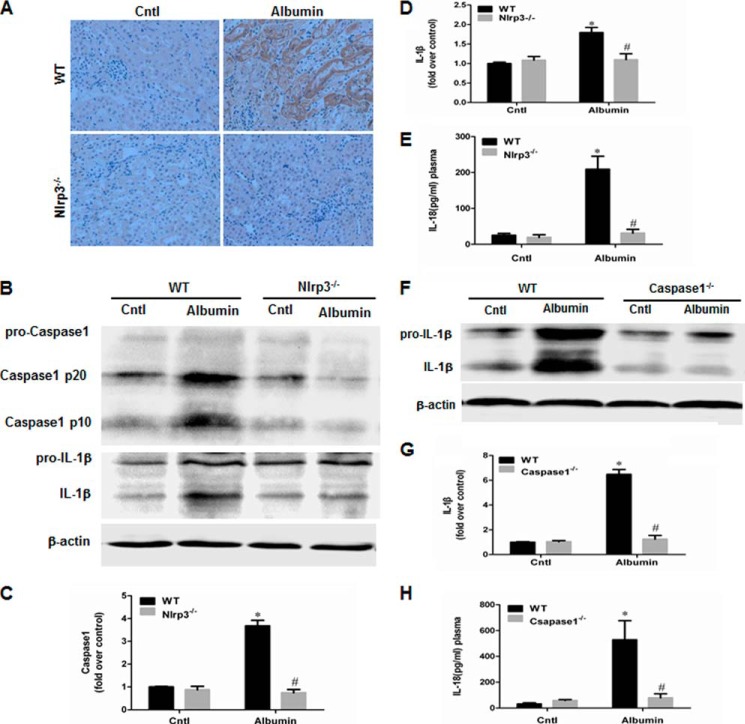
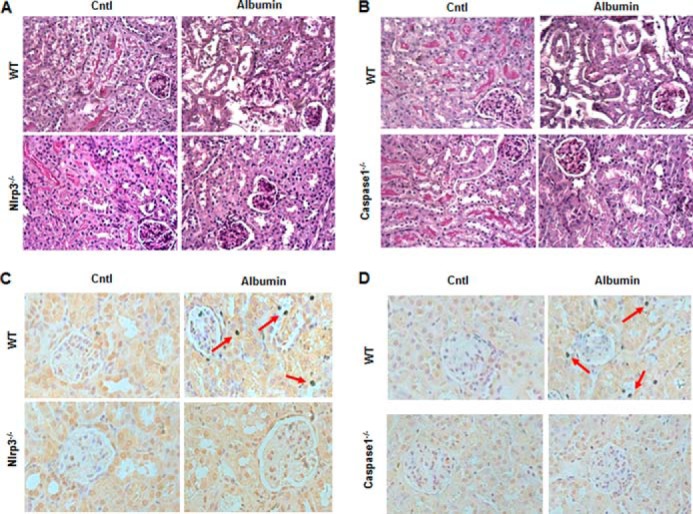
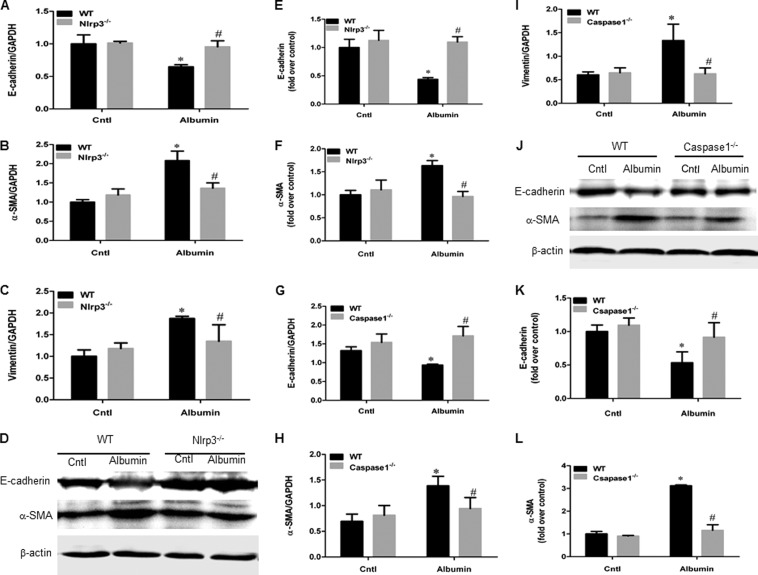
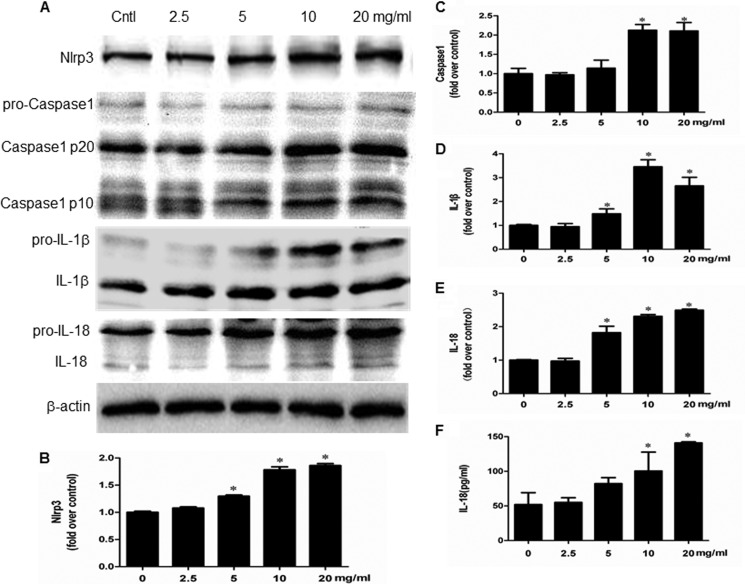
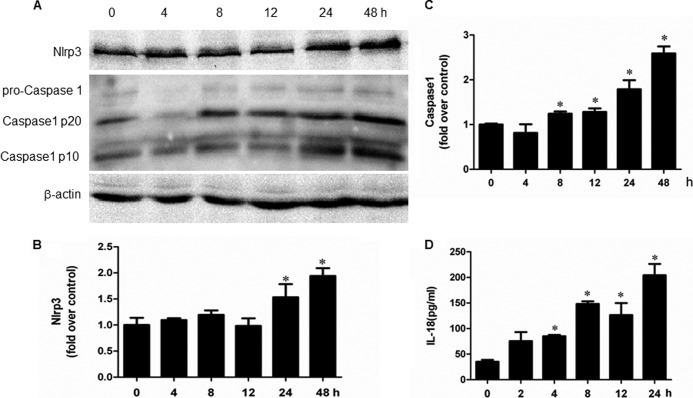
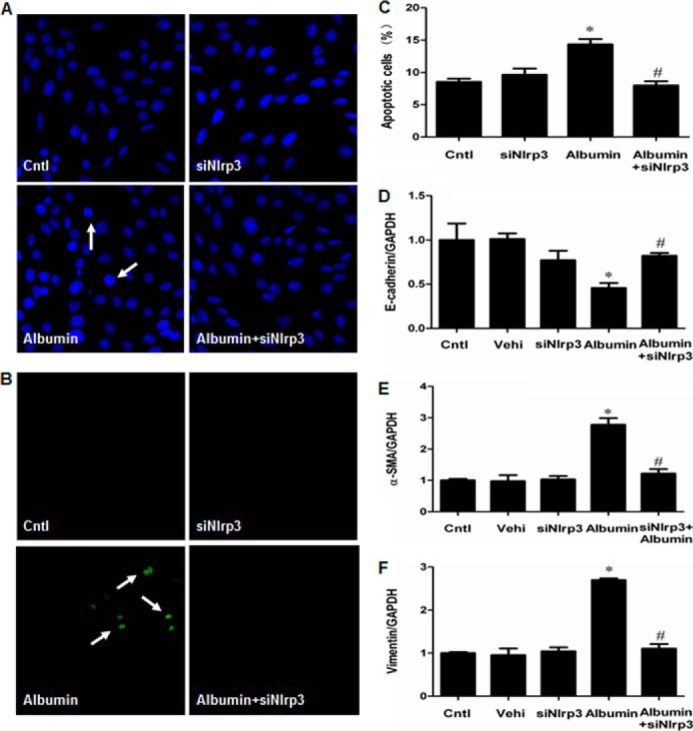
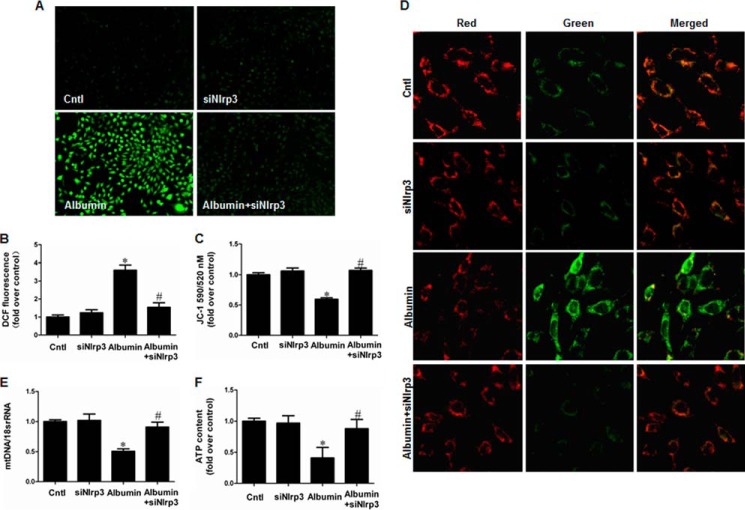
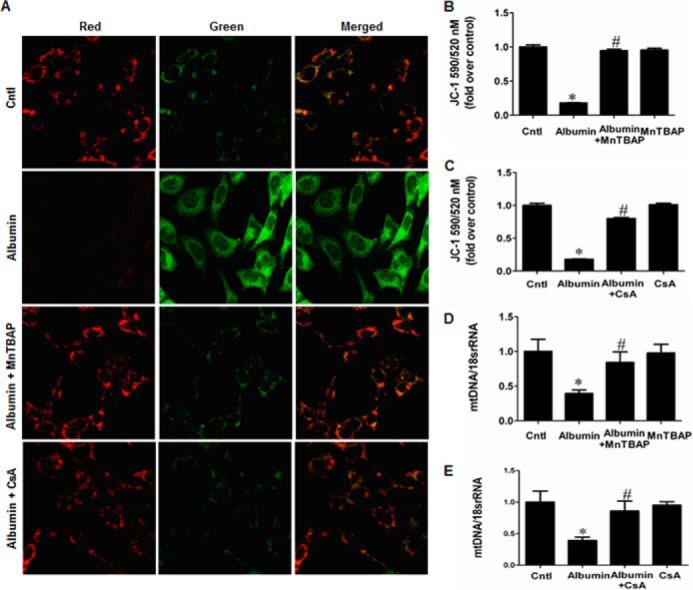
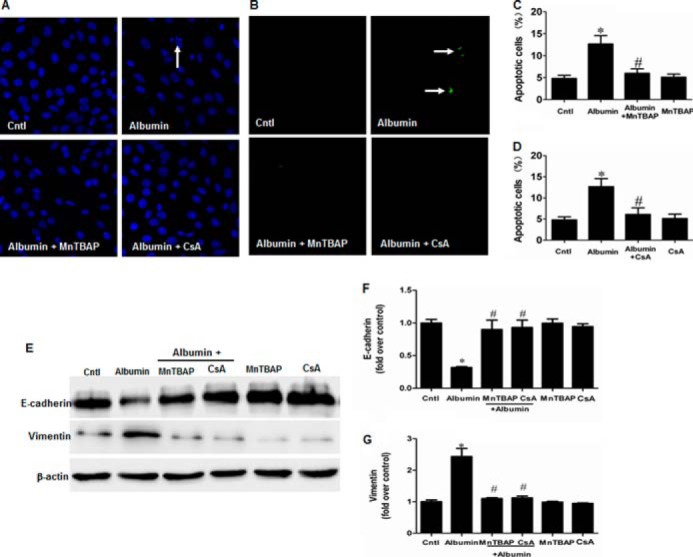
Proteinuria serves as a direct causative factor of renal tubular cell injury and is highly associated with the progression of chronic kidney disease via uncertain mechanisms. Recently, evidence demonstrated that both NLRP3 inflammasome and mitochondria are involved in the chronic kidney disease progression. The present study was undertaken to examine the role of NLRP3 inflammasome/mitochondria axis in albumin-induced renal tubular injury. In patients with proteinuria, NLRP3 was significantly up-regulated in tubular epithelial cells and was positively correlated with the severity of proteinuria. In agreement with these results, albumin remarkably activated NLRP3 inflammasome in both in vitro renal tubular cells and in vivo kidneys in parallel with significant epithelial cell phenotypic alteration and cell apoptosis. Genetic disruption of NLRP3 inflammasome remarkably attenuated albumin-induced cell apoptosis and phenotypic changes under both in vitro and in vivo conditions. In addition, albumin treatment resulted in a significant mitochondrial abnormality as evidenced by the impaired function and morphology, which was markedly reversed by invalidation of NLRP3/caspase-1 signaling pathway. Interestingly, protection of mitochondria function by Mn(III)tetrakis (4-benzoic acid) porphyrin (MnTBAP) or cyclosporin A (CsA) robustly attenuated albumin-induced injury in mouse proximal tubular cells. Collectively, these findings demonstrated a pathogenic role of NLRP3 inflammasome/caspase-1/mitochondria axis in mediating albumin-induced renal tubular injury. The discovery of this novel axis provides some potential targets for the treatment of proteinuria-associated renal injury.

Keywords: Apoptosis; Epithelial Cell; Inflammasome; Kidney; Mitochondria; Mitochondrial Dysfunction; NLRP3 Inflammasome; Proteinuria; Renal Tubular Cells.


Figures

FIGURE 1.
FIGURE 1.
Expression of NLRP3 in renal biopsy specimens. A, NLRP3 expression, as detected by immunohistochemistry, in children with mild, moderate, or severe proteinuria. B, densitometric analysis of NLRP3 expression. C, correlation analysis of NLRP3 expression and proteinuria severity. The values represent the means ± S.D. (n = 6). *, p < 0.01 versus control (Cont or Cntl).
FIGURE 2.
FIGURE 2.
Deletion of NLRP3 in mouse blocked albumin overload-induced NLRP3 inflammasome activation in kidney. A, NLRP3 expression, as detected by immunohistochemistry, in NLRP3 WT and KO mice after albumin overload. B, Western blots of the active caspase-1 and IL-1β in NLRP3 WT and KO mice following albumin overload. C, densitometric analysis of total active caspase-1 in NLRP3 WT and KO mice. D, densitometric analysis of IL-1β Western blot in NLRP3 WT and KO mice. E, ELISA analysis of plasma IL-18 concentration in NLRP3 WT and KO mice following albumin overload. F, Western blots of IL-1β in caspase-1 WT and KO mice after albumin overload. G, densitometric analysis of IL-1β Western blot in caspase-1 WT and KO mice. H, ELISA analysis of plasma IL-18 concentration in caspase-1 WT and KO mice following albumin overload. The values represent the means ± S.D. (n = 8). *, p < 0.01 versus control (Cntl); #, p < 0.01 versus albumin-overloaded WT mice.
FIGURE 3.
FIGURE 3.
Deletion of NLRP3 in mouse attenuated albumin overload-induced tubular injury and cellular apoptosis. A, kidney periodic acid-Schiff staining in NLRP3 WT and KO mice following albumin overload. B, kidney periodic acid-Schiff staining in caspase-1 WT and KO mice following albumin overload. C, TUNEL staining in the kidney of NLRP3 WT and KO mice following albumin overload. D, TUNEL staining in the kidney of caspase-1 WT and KO mice following albumin overload. The arrows indicate TUNEL-positive tubular epithelial cells. Cntl, control.
FIGURE 4.
FIGURE 4.
Deletion of NLRP3 inflammasome in mouse blunted phenotypic changes of tubular epithelial cells induced by albumin overload. A, qRT-PCR analysis of E-cadherin in NLRP3 WT and KO mice. B, qRT-PCR analysis of α-SMA in NLRP3 WT and KO mice. C, qRT-PCR analysis of vimentin in NLRP3 WT and KO mice. D, Western blots of E-cadherin and α-SMA in NLRP3 WT and KO mice. E, densitometric analysis of E-cadherin in NLRP3 WT and KO mice. F, densitometric analysis of α-SMA in NLRP3 WT and KO mice. G, qRT-PCR analysis of E-cadherin in caspase-1 WT and KO mice. H, qRT-PCR analysis of α-SMA in caspase-1 WT and KO mice. I, qRT-PCR analysis of vimentin in caspase-1 WT and KO mice. J, Western blots of E-cadherin and α-SMA in caspase-1 WT and KO mice. K, densitometric analysis of E-cadherin in caspase-1 WT and KO mice. L, densitometric analysis of α-SMA in caspase-1 WT and KO mice. The values represent the means ± S.D. (n = 8). *, p < 0.01 versus control (Cntl); #, p < 0.01 versus albumin-overloaded WT mice.
FIGURE 5.
FIGURE 5.
Deletion of NLRP3 or caspase-1 inhibited albumin overload-induced mitochondrial dysfunction in mice. A, representative images of mitochondrial morphology by TEM in renal proximal tubular epithelial cells of NLRP3 WT and KO mice. B, Western blots of cytochrome c (CytC) in the cytosolic and mitochondrial fractions of kidney cortex in NLRP3 WT and KO mice. C, Western blots of cytochrome c in the cytosolic and mitochondrial fractions of kidney cortex in caspase-1 WT and KO mice. D, qRT-PCR analysis of ATP synthase in NLRP3 WT and KO mice. E, qRT-PCR analysis of ATP synthase in caspase-1 WT and KO mice. F, qRT-PCR analysis of mtDNA in NLRP3 WT and KO mice. G, qRT-PCR analysis of mtDNA in caspase-1 WT and KO mice. The values represent the means ± S.D. (n = 8). *, p < 0.01 versus control (Cntl); #, p < 0.01 versus albumin-overloaded WT mice.
FIGURE 6.
FIGURE 6.
Albumin treatment induced cell apoptosis in mPTC. A, Hoechst 33258 staining. B, TUNEL staining. Confluent mPTCs were exposed to vehicle or albumin (10 mg/ml) for 24 h. The arrows indicate chromatin condensation and fragmentation (A) or TUNEL-positive signals (B). C, quantification of apoptotic cells by flow cytometry. mPTCs were incubated with albumin at the indicated concentrations (0–20 mg/ml) for 24 h. The values represent the means ± S.D. (n = 6 in each group). *, p < 0.01 versus control (Cntl).
FIGURE 7.
FIGURE 7.
Albumin treatment altered tubular epithelial cell phenotype. A, representative images of morphological changes. The cells were treated with vehicle or albumin (10 mg/ml) for 48 h. Photographs were taken using a Nikon microscope (phase contrast). B, Western blots of E-cadherin, α-SMA, and vimentin in mPCT cells treated by different concentration of albumin (0–20 mg/ml) for 48h. C–E, densitometric analysis of E-cadherin (C), α-SMA (D), and vimentin (E). F, Western blotting analysis of E-cadherin, α-SMA, and vimentin in mPTC cells treated by 10 mg/ml albumin in a time course study (0–48 h). G–I, densitometric analysis of E-cadherin (G), α-SMA (H), and vimentin (I) for the time course study. The values represent the means ± S.D. (n = 6). *, p < 0.01 versus control (Cntl).
FIGURE 8.
FIGURE 8.
Albumin dose-dependently activated NLRP3 inflammasome in mPTC cells. A, Western blots of NLRP3, active caspase-1, IL-1β, and IL-18. Cells were treated with albumin (0–20 mg/ml) for 24 h. B–E, densitometric analysis of NLRP3 (B), active caspase-1 (C), IL-1β (D), and IL-18 (E). F, ELISA analysis of IL-18 concentration in medium. Confluent mPTCs were incubated with albumin at the indicated concentrations for 24 h, and the medium was collected to detect IL-18 by ELISA. The values represent the means ± S.D. (n = 6). *, p < 0.01 versus control (Cntl).
FIGURE 9.
FIGURE 9.
Albumin time-dependently activated NLRP3 inflammasome in mPTC cells. A, Western blots of NLRP3, active caspase-1. Cells were treated with albumin (10 mg/ml) for 0–48 h. B and C, densitometric analysis of NLRP3 (B) and active caspase-1 (C). D, ELISA analysis of IL-18 concentration in medium. Confluent mPTCs were incubated with albumin (10 mg/ml) for 0–48 h. The cell culture medium was collected to detect IL-18 by ELISA. The values represent the means ± S.D. (n = 6). *, p < 0.01 versus control.
FIGURE 10.
FIGURE 10.
siNLRP3 prevented NLRP3 inflammasome activation in mPTC induced by albumin. A, Western blot of NLRP3 protein expression. Cells were transfected with siNLRP3 or scramble siRNA (Vehi), and untreated cells were used as the control (Cntl). B, densitometric analysis of NLRP3 following siNLRP3 transfection. C, Western blots of active caspase-1, IL-1β, and IL-18. Cells were transfected with siNlrp3 for 48 h and then incubated with albumin (10 mg/ml) for an additional 24 h. D–F, densitometric analysis of active caspase-1 (D), IL-1β (E), and IL-18 (F). G, ELISA analysis of IL-18 levels. Cells were transfected with siNlrp3 for 48 h and then incubated with albumin (10 mg/ml) for an additional 24 h. The cell culture medium was collected to detect IL-18 by ELISA. The values represent the means ± S.D. (n = 6). *, p < 0.01 versus vehicle; #, p < 0.01 versus albumin group.
FIGURE 11.
FIGURE 11.
siNLRP3 prevented albumin-induced cell apoptosis and cell phenotypic alteration in mPTC. A, Hoechst 33258 staining. The arrows indicate chromatin condensation and fragmentation. B, TUNEL staining. The arrows indicate TUNEL-positive signals. C, quantification of apoptotic cells by flow cytometry. D–F, qRT-PCR analysis of E-cadherin (D), α-SMA (E), and vimentin (F) expressions. Confluent mPTCs were transfected with siNlrp3 for 48 h and then incubated with albumin (10 mg/ml) for an additional 24 h. The values represent the means ± S.D. (n = 6). *, p < 0.01 versus vehicle (Vehi); #, p < 0.01 versus albumin group. Cntl, control.
FIGURE 12.
FIGURE 12.
siNLRP3 effect on albumin-induced mitochondrial dysfunction in mPTCs. siNLRP3 inhibited albumin-induced mitochondrial dysfunction in mPTCs. Cells were transfected with siNlrp3 for 48 h and then incubated with albumin (10 mg/ml) for 24 h. A and B, ROS production. A, representative images of mPTCs stained with dichlorodihydrofluorescein diacetate. B, quantitation of 2′,7′-dichlorofluorescein fluorescence by flow cytometry. C and D, MMP. C, quantitation of JC-1 fluorescence by flow cytometry. D, representative images JC-1 staining. E, the mtDNA copy number. F, ATP content. The values represent the means ± S.D. (n = 6). *, p < 0.01 versus siNlrp3 group; #, p < 0.01 versus albumin group. Cntl, control.
FIGURE 13.
FIGURE 13.
MnTBAP and CsA inhibited albumin-induced mitochondrial dysfunction in mPTCs. Cells were pretreated with MnTBAP (100 mm) or CsA (0.5 mg/ml) for 30 min, followed by incubation with albumin (10 mg/ml) for 24 h. A, representative photographs of JC-1 staining. B, MMP determined by JC-1 following MnTBAP treatment. C, MMP determined by JC-1 following CsA treatment. D, mtDNA copy number following MnTBAP treatment. E, mtDNA copy number following CsA treatment. The values represent the means ± S.D. (n = 6). *, p < 0.01 versus control (Cntl); #, p < 0.01 versus albumin-treated mPTCs.
FIGURE 14.
FIGURE 14.
MnTBAP and CsA prevented albumin-induced cell apoptosis and cell phenotypic alteration in mPTC. A, Hoechst 33258 staining. The arrow indicates chromatin condensation and fragmentation. B, TUNEL staining. The arrows indicate TUNEL-positive signals. C, cell apoptosis following MnTBAP treatment determined by flow cytometry. D, cell apoptosis following CsA treatment determined by flow cytometry. Cells were pretreated with MnTBAP (100 mm) or CsA (0.5 mg/ml) for 30 min, followed by incubation with albumin (10 mg/ml) for 24 h. E, Western blots of E-cadherin and vimentin in mPTCs following albumin treatment with MnTBAP or CsA. Cells were pretreated with MnTBAP (100 mm) or CsA (0.5 mg/ml) for 30 min, followed by incubation with albumin (10 mg/ml) for 48 h. F, densitometric analysis of E-cadherin. G, densitometric analysis of vimentin. The values represent the means ± S.D. (n = 6). *, p < 0.01 versus control (Cntl); #, p < 0.01 versus albumin-treated mPTCs.

References

    1. Burton C., Harris K. P. (1996) The role of proteinuria in the progression of chronic renal failure. Am. J. Kidney Dis. 27, 765–775 - PubMed
    1. Eddy A. A. (2004) Proteinuria and interstitial injury. Nephrol. Dial Transplant. 19, 277–281 - PubMed
    1. Zoja C., Morigi M., Remuzzi G. (2003) Proteinuria and phenotypic change of proximal tubular cells. J. Am. Soc. Nephrol. 14, S36–S41 - PubMed
    1. Li X., Pabla N., Wei Q., Dong G., Messing R. O., Wang C. Y., Dong Z. (2010) PKC-δ promotes renal tubular cell apoptosis associated with proteinuria. J. Am. Soc. Nephrol. 21, 1115–1124 - PMC - PubMed
    1. Niaudet P., Rötig A. (1996) Renal involvement in mitochondrial cytopathies. Pediatr. Nephrol. 10, 368–373 - PubMed

Publication types

MeSH terms

LinkOut - more resources