. 2014 Dec;13(6):965-74.
doi: 10.1111/acel.12257. Epub 2014 Jul 25.

RNA-seq of the aging brain in the short-lived fish N. furzeri - conserved pathways and novel genes associated with neurogenesis

Affiliations

RNA-seq of the aging brain in the short-lived fish N. furzeri - conserved pathways and novel genes associated with neurogenesis

Mario Baumgart et al. Aging Cell. 2014 Dec.

Abstract

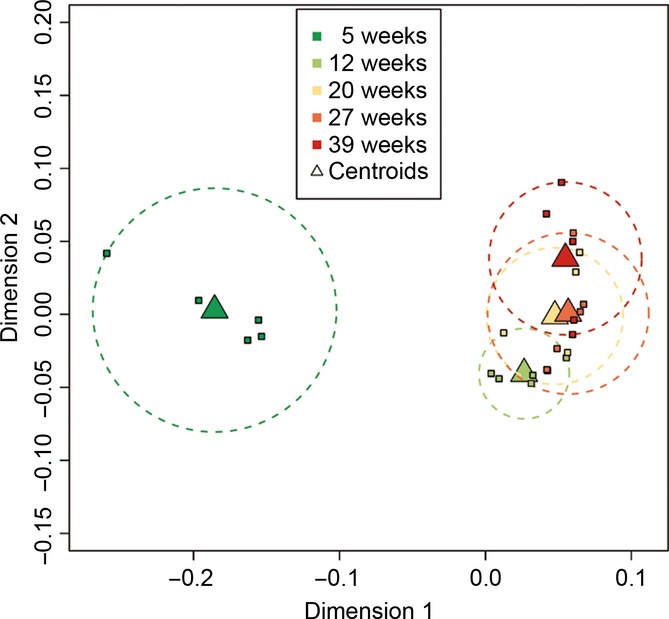
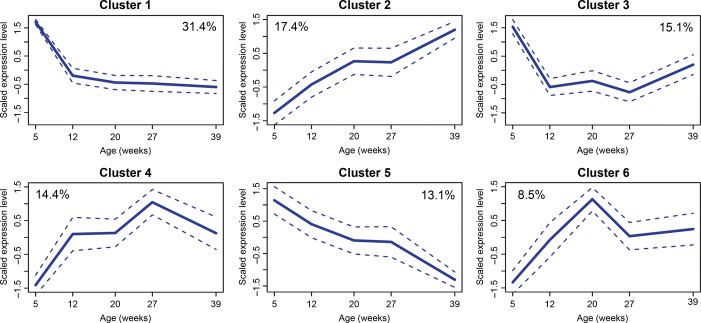
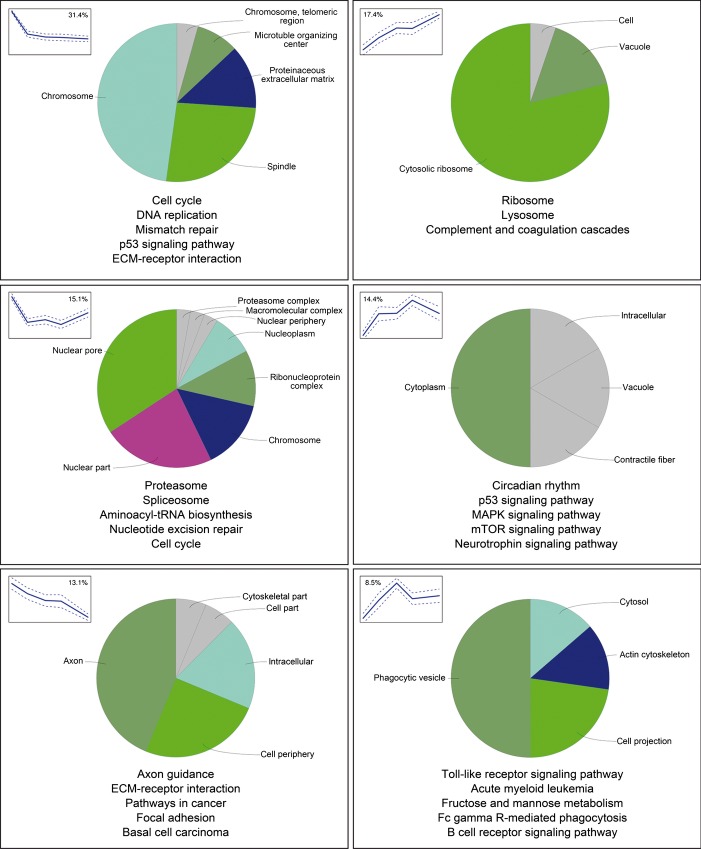
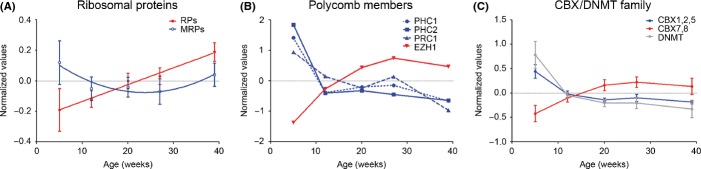
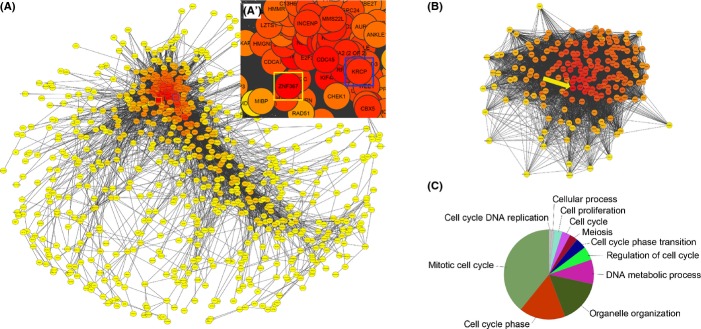
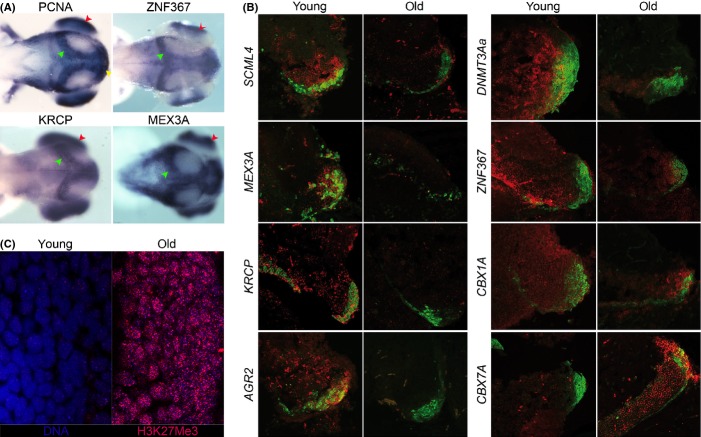
The brains of teleost fish show extensive adult neurogenesis and neuronal regeneration. The patterns of gene regulation during fish brain aging are unknown. The short-lived teleost fish Nothobranchius furzeri shows markers of brain aging including reduced learning performances, gliosis, and reduced adult neurogenesis. We used RNA-seq to quantify genome-wide transcript regulation and sampled five different time points to characterize whole-genome transcript regulation during brain aging of N. furzeri. Comparison with human datasets revealed conserved up-regulation of ribosome, lysosome, and complement activation and conserved down-regulation of synapse, mitochondrion, proteasome, and spliceosome. Down-regulated genes differ in their temporal profiles: neurogenesis and extracellular matrix genes showed rapid decay, synaptic and axonal genes a progressive decay. A substantial proportion of differentially expressed genes (~40%) showed inversion of their temporal profiles in the last time point: spliceosome and proteasome showed initial down-regulation and stress-response genes initial up-regulation. Extensive regulation was detected for chromatin remodelers of the DNMT and CBX families as well as members of the polycomb complex and was mirrored by an up-regulation of the H3K27me3 epigenetic mark. Network analysis showed extensive coregulation of cell cycle/DNA synthesis genes with the uncharacterized zinc-finger protein ZNF367 as central hub. In situ hybridization showed that ZNF367 is expressed in neuronal stem cell niches of both embryonic zebrafish and adult N. furzeri. Other genes down-regulated with age, not previously associated with adult neurogenesis and with similar patterns of expression are AGR2, DNMT3A, KRCP, MEX3A, SCML4, and CBX1. CBX7, on the other hand, was up-regulated with age.

Keywords: animal model; brain aging; epigenetics; gene expression; neural stem cells; neurogenesis; teleost; transcriptomics.


Figures

Figure 1
Figure 1
Multidimensional scaling. Age of samples is color-coded. Individual samples are represented by small squares, the centroids by triangles, and the confidence interval by dotted circles.
Figure 2
Figure 2
Fuzzy c-means clustering of 4014 differentially expressed genes (DEGs) according to temporal profiles. Each individual DEG profile was centered to mean and scaled to variance. The solid line represents the mean value of the cluster and the dashed lines 95% confidence intervals. For each cluster, the percentage of DEGs assigned to it is reported. Clusters are ordered according total number of members.
Figure 3
Figure 3
Gene enrichment analysis of the individual fuzzy c-means (FCM) clusters. The pie charts correspond to clustering of enriched cellular component terms as generated by ClueGO. The dimension of the wedges is proportional to the number of clustered terms, and the term with the highest number of differentially expressed genes was used for annotation. Gray wedges indicate individual terms that could not be clustered. The text below the pie charts reports the five most enriched KEGG pathways for each of the FCM clusters.
Figure 4
Figure 4
Age-dependent transcript levels of selected differentially expressed genes. Expression values at each age were centered and scaled to the mean. (A) The average of all 87 ribosomal genes (RP) and mitochondrial ribosomal genes (MRP) are shown. Error bars represent standard deviations. (B) Members of the polycomb complexes 1 and 2. (C) Averaged expression of all DNMT genes and members of the CBX genes family. CBX members in cluster 1 are shown in blue, and CBX members in clusters 2 and 6 are shown in red.
Figure 5
Figure 5
Network analysis. (A) Network of RKPM values of all expressed genes based on Pearson's correlation r ≥ 0.95, spring-embedded layout weighted on correlation. Color of nodes indicates the edge degree value with red assigned to nodes of highest values. Only the cluster with largest number of nodes is shown. (A′) Enlargement of (A): ZNF367, the node of highest edge, is indicated by yellow square, the position of KRCP, a gene of high edge degree value that was further studied by in situ hybridization, is indicated by a blue square. (B) Network of the first neighbors of ZNF367, 192 nodes, 1030 edges. The position of ZNF367 is indicated by a yellow arrow. (C) Gene enrichment analysis of ZNF367 first neighbors.
Figure 6
Figure 6
In situ hybridization and immunohistochemistry. (A) Dorsal view of 72 hpf zebrafish embryos processed by in situ hybridization for ZNF367,KRCP, and MEX3A. Proliferating cell nuclear antigen (PCNA) riboprobe has been used to visualize proliferative region of the zebrafish larval brain in the optic tectum (green arrowhead) and retina (red arrow head). (B) Double-labeling in situ hybridization (ISH) and immunohistochemistry (IHC) on the posterior margin of the optic tectum (OTp) in Nothobranchius furzeri for the following genes: SCML4,MEX3A,KRCP,AGR2,DNMT3AA,ZNF367,CBX1A, and CBX7A – ISH signal was revealed using fluorescent Fast Red and is visualized in red, PCNA IHC is visualized in green to localize the proliferative niche of the OTp. Only merged signals are shown. Young animals were 6 weeks old, and old animals were 25 weeks old. Separated red and green channels are reported in Fig. S10. The images are representative of three replicates. (C) Changes of PRC2 markers with age. Immunohistochemical detection of H3K27me3 in the posterior optic tectum of young (5 weeks) and old (35 weeks) individuals. The images are representative of three replicates. Immunohistochemical signal is shown in red and DNA staining (TOPRO3) in blue. Overlap of signals gives rise to a purple hue.

References

    1. Beckervordersandforth R, Tripathi P, Ninkovic J, Bayam E, Lepier A, Stempfhuber B, Kirchhoff F, Hirrlinger J, Haslinger A, Lie DC, Beckers J, Yoder B, Irmler M, Gotz M. In vivo fate mapping and expression analysis reveals molecular hallmarks of prospectively isolated adult neural stem cells. Cell Stem Cell. 2010;7:744–758. - PubMed
    1. Ben Abdallah NM, Slomianka L, Vyssotski AL, Lipp HP. Early age-related changes in adult hippocampal neurogenesis in C57 mice. Neurobiol. Aging. 2010;31:151–161. - PubMed
    1. Blazek R, Polacik MJ, Reichard M. Rapid growth, early maturation and short generation time in African annual fishes. EvoDevo. 2013;4:24. - PMC - PubMed
    1. Buchet-Poyau K, Courchet J, Le Hir H, Seraphin B, Scoazec JY, Duret L, Domon-Dell C, Freund JN, Billaud M. Identification and characterization of human Mex-3 proteins, a novel family of evolutionarily conserved RNA-binding proteins differentially localized to processing bodies. Nucleic Acids Res. 2007;35:1289–1300. - PMC - PubMed
    1. Chapouton P, Skupien P, Hesl B, Coolen M, Moore JC, Madelaine R, Kremmer E, Faus-Kessler T, Blader P, Lawson ND, Bally-Cuif L. Notch activity levels control the balance between quiescence and recruitment of adult neural stem cells. J. Neurosci. 2010;30:7961–7974. - PMC - PubMed

Publication types