Clinical Trial
. 2014 Jul 25:5:4446.
doi: 10.1038/ncomms5446.

Host iron status and iron supplementation mediate susceptibility to erythrocytic stage Plasmodium falciparum

Affiliations
Clinical Trial

Host iron status and iron supplementation mediate susceptibility to erythrocytic stage Plasmodium falciparum

Martha A Clark et al. Nat Commun. .

Abstract

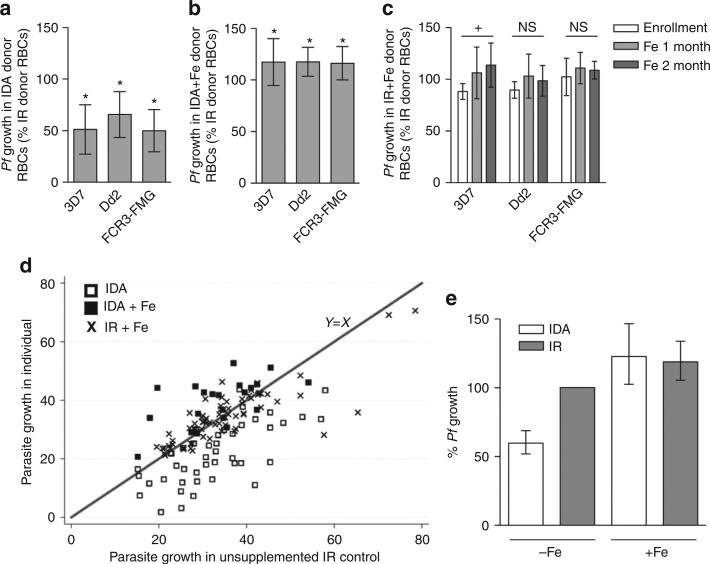
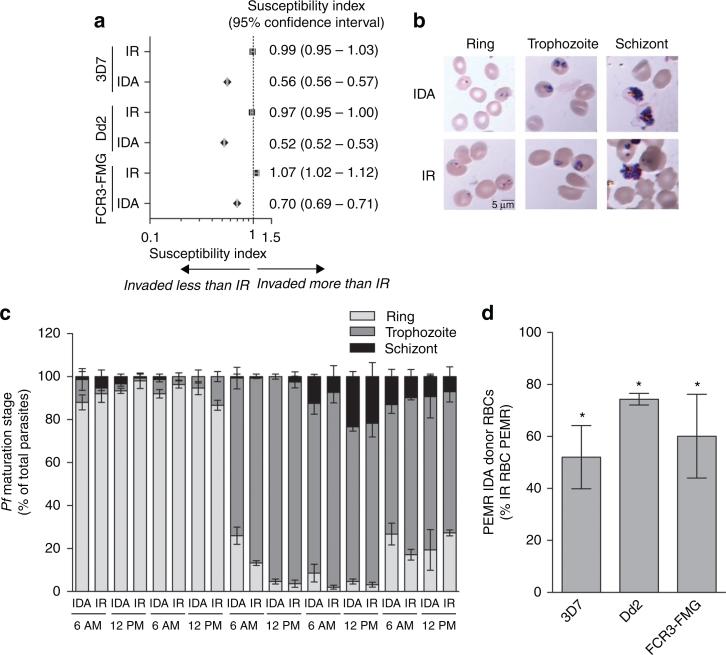
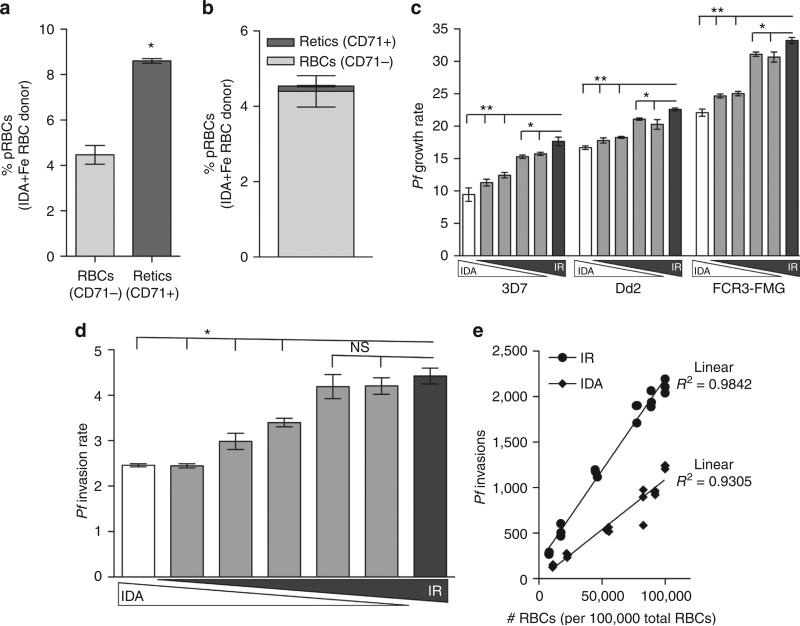
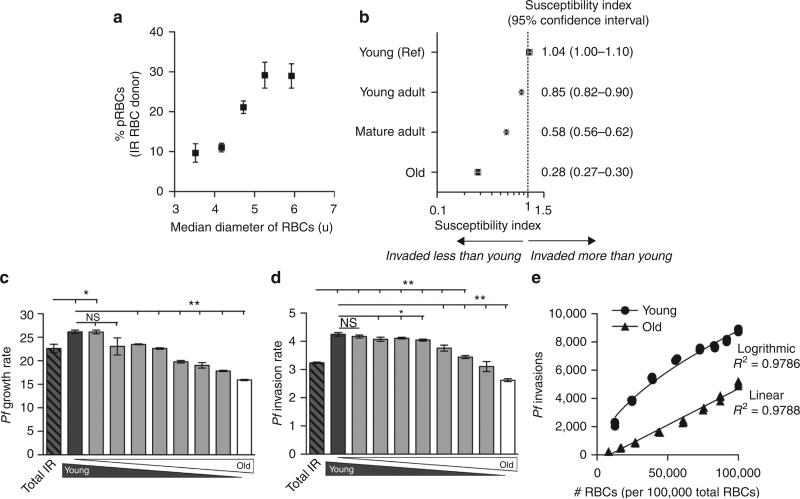
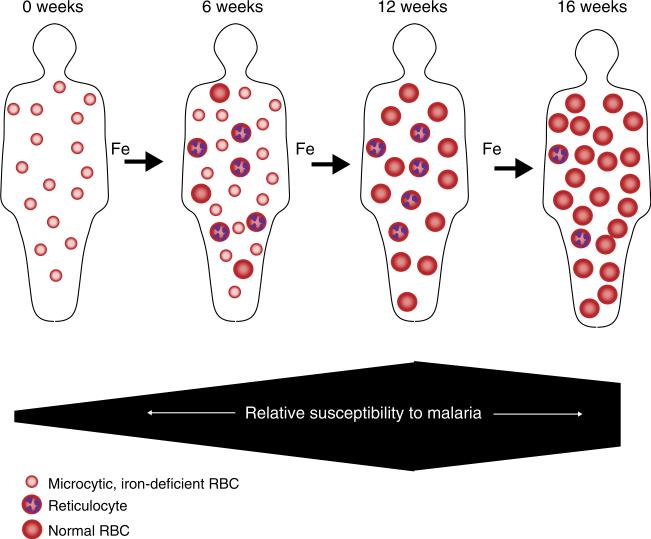
Iron deficiency and malaria have similar global distributions, and frequently co-exist in pregnant women and young children. Where both conditions are prevalent, iron supplementation is complicated by observations that iron deficiency anaemia protects against falciparum malaria, and that iron supplements increase susceptibility to clinically significant malaria, but the mechanisms remain obscure. Here, using an in vitro parasite culture system with erythrocytes from iron-deficient and replete human donors, we demonstrate that Plasmodium falciparum infects iron-deficient erythrocytes less efficiently. In addition, owing to merozoite preference for young erythrocytes, iron supplementation of iron-deficient individuals reverses the protective effects of iron deficiency. Our results provide experimental validation of field observations reporting protective effects of iron deficiency and harmful effects of iron administration on human malaria susceptibility. Because recovery from anaemia requires transient reticulocytosis, our findings imply that in malarious regions iron supplementation should be accompanied by effective measures to prevent falciparum malaria.


Figures

Figure 1
Figure 1. P. falciparum growth is reduced in iron-deficient RBCs and iron supplementation eliminates growth attenuation
(a–c) Growth experiments with RBCs from IDA donors (n = 7), IDA + Fe donors (n = 5) and IR + Fe donors (n = 4) were performed. Growth rate RBCs from an IR donor served as the control. Bars represent growth of P. falciparum (strains 3D7, Dd2 and FCR3-FMG) in indicated RBCs, normalized to growth in RBCs from IR donors (% Pf growth in IR RBC). Error bars represent the s.d. (a) Bars represent growth in RBCs from IDA donors. Significance was determined by two-tailed paired Student's t-test. *Po3E as compared with P. falciparum growth in RBCs from IR donors. (b) Bars represent growth in RBCs from IDA + Fe donors. Significance was determined by two-tailed paired Student's t-test. *P<0.0003 as compared with P. falciparum growth in RBCs from IR donors. (c) Bars represent growth of P. falciparum in RBCs from IR + Fe donors at enrollment, 1 month and 2 months on iron, normalized to growth in RBCs from IR donors (% Pf growth in IR RBC). Significance was determined by one-way analysis of variance. P<0.02 for strain 3D7and nonsignificant (n.s.) for strains Dd2 and FCR3-FMG. (d) Mean growth rate of P. falciparum in RBCs from each individual IDA (□), IR + Fe (■) and IDA + Fe (’) donor plotted against the growth rate of P. falciparum in corresponding control RBCs from non-supplemented IR donors. Data were analysed by mixed effects regression. The Y = X line was fit to the growth rates (in RBCs from IR donors). Points below the Y = X line indicate growth rates less than that within RBCs from IR donors. (e) Graphical summary of the mixed effects regression analysis shown in d. Donor and parasite preparation were fitted as crossed random effects. The bars show the estimated parasite growth of P. falciparum in RBCs from the IDA, IDA + Fe and IR + Fe donors as a percent of P. falciparum growth in RBCs from non-supplemented IR donors. Error bars represent the 95% confidence interval.
Figure 2
Figure 2. P. falciparum invasion and growth are reduced in RBCs from IDA donors
(a) Direct comparison of invasion into RBCs from either IDA or IR donors. Invasion experiments for RBCs from all IDA donors were performed independently and each experiment was performed in triplicate. Data show the mean SI of six independent experiments performed with RBCs from six IDA donors. The marker represents the SI point estimate and the bar represents the 95% CI. An SI of 1.0 indicates no difference in parasite invasion of the two RBC populations. (b,c) Comparison of the maturation of P. falciparum in RBCs donated by IDA and IR donors. Geimsa-stained thin blood smears were made every 6 h and 1,000 RBCs were counted by light microscopy to determine the percent of pRBCs as well as parasite intra-erythrocytic stage of maturation. Data are from a representative experiment (with strain FCR3-FMG) of three independent experiments performed with RBCs from three IDA donors infected with either P. falciparum strain 3D7, Dd2or FCR3. (b) Giemsa-stained thin blood smears of P. falciparum ring, trophozoite and schizont stage parasites in RBCs from an IDA and an IR donor. (c) Bars indicate percent frequency of parasite ring, trophozoite and schizont stages in RBCs from an IDA and IR donor at each 6 h time point. Error bars represent the s.d. (d) Comparison of the parasite erythrocyte multiplication rate (PEMR) of P. falciparum within RBCs from IDA and IR donors. Bars represent PEMR of P. falciparum in RBCs from IDA donors, normalized to the PEMR of parasites in RBCs from IR donors (% IR PEMR). Data are the mean of three independent experiments performed in triplicate with RBCs from three IDA donors. Error bars represent the s.d. Significance determined by two-tailed paired Student's t-test.*P<3E −6, compared with PEMR in RBCs from IR donors.
Figure 3
Figure 3. Replacement of iron-deficient RBCs with iron-replete RBCs increases P. falciparum infection
(a,b) P. falciparum (strain 3D7) infection of reticulocytes (CD71 + ) and mature RBCs (CD71−) from an IDA + Fe donor. (a) Bars represent the percent of parasitized reticulocytes (CD71+) and mature RBCs (CD71−). Error bars represent the s.d. *P<0.0001. (b) Contribution of parasitized reticulocytes (CD71+) and parasitized mature RBCs (CD71−) to the total infection. Error bars represent the standard deviation. (c) Growth rate of P. falciparum in RBC populations in which IDA RBCs were replaced with IR RBCs. RBCs were inoculated individually or together in the same wells at different ratios (100% IDA; 90% IDA and 10% IR; 75% IDA and 25% IR; 50% IDA and 50% IR; 25% IDA and 75% IR; 100% IR) and subsequently infected. Elongated triangles below the x axis represent the percentage of IDA RBCs (white triangle) and IR RBCs (grey triangle) in the total RBC population. Bars represent parasite growth rates after one 96 h growth assay. Error bars represent the s.d. *P<0.01 and **P<0.0003. (d and e) Invasion rate of P. falciparum into RBC populations in which IDA RBCs were replaced with IR RBCs. Differentially labelled RBC donors were inoculated individually or together in the same wells at different ratios (100% IDA; 90% IDA and 10% IR; 80% IDA and 20% IR; 50% IDA and 50% IR; 20% IDA and 80% IR; 10% IDA and 90% IR; 100% IR). Each invasion condition contained 20 × 106 total RBCs. (d) Bars represent parasite invasion rate. Elongated triangles below the x axis represent the percentage of IDA RBCs (white triangle) and IR RBCs (grey triangle) in the total RBC population. Error bars represent the s.d. *P<0.001, compared with P. falciparum invasion rate into 100% IR RBCs. (e) Number of invasions events into IDA (diamonds) and IR (circles) RBCs as the frequency of each increases. Linear regression was used to determine the best fit lines for the data (IR R2 = 0.9842 and IDA R2 = 0.9305). Analysis of covariance was performed to compare the slopes of the lines and calculated P<0.0001. The null hypothesis was no difference between the two RBC types (H0: βIron replete = βIron deficient, α = 0.05) n.s., nonsignificant.
Figure 4
Figure 4. The elevated P. falciparum infection supported by young RBCs is reversed as young RBCs are replaced with old RBCs
(a) Percent P. falciparum (strain 3D7) infection of RBCs of increasing diameter. Data points represent the % pRBCs of five gated RBC populations of increasing volume. Error bars represent the s.d. (b) Direct comparison of P. falciparum (strain FCR3-FMG) invasion into RBCs of increasing age. IR RBCs were separated into five fractions of increasing density, a proxy for increasing RBC age (Supplementary Fig. 3a–d). The markers represent the SI point estimate and the bar represents the 95% CI. (c) Growth rate of P. falciparum (strain FCR3-FMG) in RBC populations in which young IR RBCs were replaced with old IR RBCs (0%, 10%, 20%, 33%, 50%, 66%, 80%, 90% and 100% replacement young RBCs with old RBCs). Elongated triangles represent the percentage of young IR RBCs (gray triangle) and old IR RBCs (white triangle) in the total RBC population. Bars represent parasite growth rates after 96 h Error bars represent the s.d. *P<0.004 and **P<0.0003, compared to growth rate in 100% total IR and 100% young RBCs respectively. (d and e) Invasion into RBC populations in which young IR RBCs were replaced with old IR RBCs. Differentially labelled young and old RBCs were inoculated individually or together in the same wells at different ratios (0%, 10%, 20%, 33%, 50%, 66%, 80%, 90% and 100% replacement young RBCs with old RBCs). (d) Bars represent invasion rates. Elongated triangles represent the percentage of young IR RBCs (gray triangle) and old IR RBCs (white triangle) in the total RBC population. Error bars represent the s.d. *P<0.05 and **P<0.003 (e) Number of invasions events into young (circles) and old (triangles) RBCs as the frequency of each increases. Linear regression was used to determine best fit lines. A linear function best fit old RBC data (R2 0.9788) and a logarithmic function best fit young RBC data (R2 = 0.9786). Analysis of covariance was performed to determine whether invasion data of old and young RBCs differed significantly, P<0.0001. The null hypothesis was no difference between the two RBC types (H0: βIron replete =βIron deficient, α 0.05)n.s., nonsignificant.
Figure 5
Figure 5. Hypothesized impact of iron deficiency and iron supplementation on host RBC population dynamics and susceptibility to erythrocytic stage malaria infection
Recovery from IDA is a complex process, which varies between individuals. Iron supplementation of an individual with IDA (0 weeks) will result in reticulocytosis and the production of young iron-replete RBCs (6 weeks). 12 weeks after the initiation of supplementation, the majority of the iron-deficient RBCs, will have been cleared from circulation (iron-deficient and iron-replete RBCs have 90 and 120 day lifespans respectively). After 16 weeks of iron supplementation, iron status has been corrected and the age structure of the RBC population will be restored. As shown above, we hypothesize that individuals with IDA will be less susceptible to erythrocytic stage malaria. The induction of erythropoiesis in these individual by iron supplementation and subsequent replacement of the iron-deficient RBCs with young iron-replete RBCs will increase the susceptibility of the individual to erythrocytic stage malaria infection. The susceptibility to infection is predicted to peak at the point when all iron-deficient RBCs have been replaced, but the age distribution of iron-replete RBCs is on average younger than a fully recovered iron-replete individual. Finally, restoration of the normal distribution of RBC age will return an individual's susceptibility to a normal level.

References

    1. Price RN, et al. Factors contributing to anemia after uncomplicated falciparum malaria. Am. J. Trop. Med. Hyg. 2001;65:614–622. - PMC - PubMed
    1. Nweneka CV, Doherty CP, Cox S, Prentice A. Iron delocalisation in the pathogenesis of malarial anaemia. Trans. R. Soc. Trop. Med. Hyg. 2010;104:175–184. - PubMed
    1. Kabyemela ER, Fried M, Kurtis JD, Mutabingwa TK, Duffy PE. Decreased susceptibility to Plasmodium falciparum infection in pregnant women with iron deficiency. J. Infect. Dis. 2008;198:163–166. - PubMed
    1. Senga EL, Harper G, Koshy G, Kazembe PN, Brabin BJ. Reduced risk for placental malaria in iron deficient women. Malar. J. 2011;10:47. - PMC - PubMed
    1. Sangaré L, van Eijk AM, Ter Kuile FO, Walson J, Stergachis A. The association between malaria and iron status or supplementation in pregnancy: a systematic review and meta-analysis. PLoS ONE. 2014;9:e87743. - PMC - PubMed

Publication types