Review
. 2014 Aug;14(8):529-45.
doi: 10.1038/nri3702.

Developmental gene networks: a triathlon on the course to T cell identity

Affiliations
Review

Developmental gene networks: a triathlon on the course to T cell identity

Mary A Yui et al. Nat Rev Immunol. 2014 Aug.

Abstract

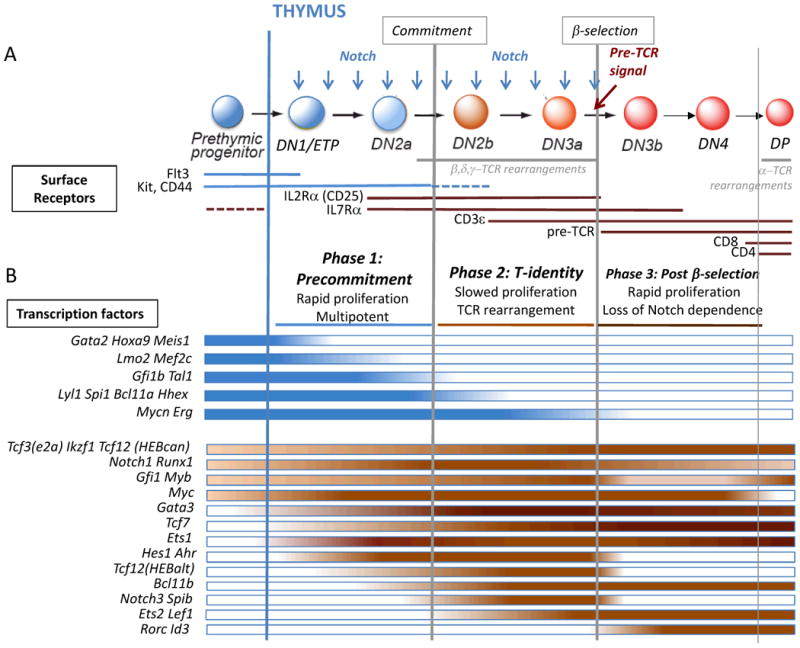
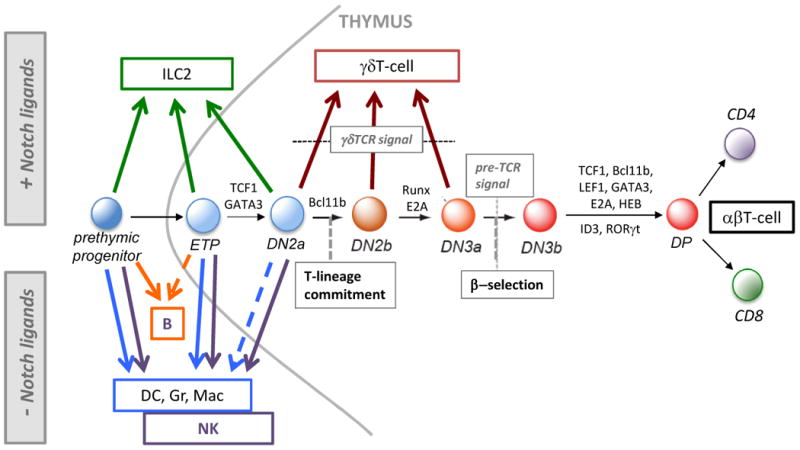
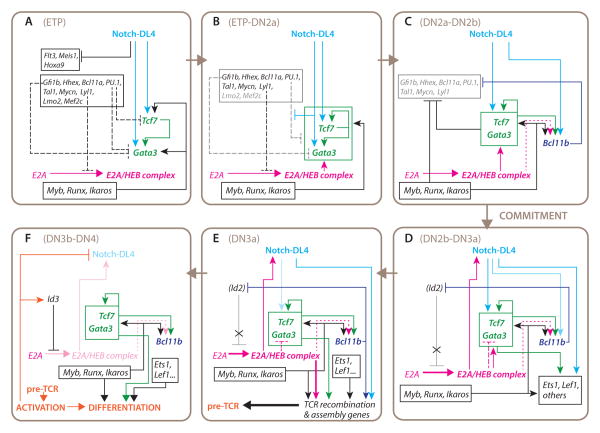
Cells acquire their ultimate identities by activating combinations of transcription factors that initiate and sustain expression of the appropriate cell type-specific genes. T cell development depends on the progression of progenitor cells through three major phases, each of which is associated with distinct transcription factor ensembles that control the recruitment of these cells to the thymus, their proliferation, lineage commitment and responsiveness to T cell receptor signals, all before the allocation of cells to particular effector programmes. All three phases are essential for proper T cell development, as are the mechanisms that determine the boundaries between each phase. Cells that fail to shut off one set of regulators before the next gene network phase is activated are predisposed to leukaemic transformation.


Conflict of interest statement

The authors declare no competing interests.

Figures

Figure 1
Figure 1. αβT-cell development: stages, surface markers, and transcription factor expression
a. Adult mouse T-cell development begins in the bone marrow from lymphoid-primed prethymic progenitors that migrate to the thymus and begin differentiation in the thymic environment, which provides Notch ligands (blue arrows). Cells transit sequentially through DN1/ETP, DN2a, DN2b, DN3a, DN3b, DN4, and DP stages on the way to becoming αβT-cells (DN: CD4- CD8-; DP: CD4+ CD8+; ISP transitional-stage cells not shown). DN1 (CD44+ CD25-) cells include a subset with high Kit expression that contains the Early T-cell Precursors (ETP; CD44+Kit++CD25-), which contain essentially all the T-cell progenitor activity and are the only kind of DN1 cells that will be considered further here. ETPs lack or have downregulated IL7R, but as they differentiate to DN2, they turn on IL7R. Key cell surface receptors used to identify these stages are shown indicating the stages during which each receptor is expressed. Dotted lines indicate stages with lower expression levels. The stages during which TCR rearrangements occur are also marked. Development is divided by the commitment and β-selection checkpoints into three major regulatory phases (Phases 1, 2, and 3: post-β-selection), each with unique gene networks and cellular characteristics. Cells in phase 1 proliferate extensively and retain multipotentiality, while phase 2 cells are committed, slow their proliferation, and undergo TCR rearrangements. Only cells with a rearranged TCRβ that can combine with pre-Tα and transduce a signal can continue through the β-selection checkpoint into phase 3, a second highly proliferative but increasingly Notch-independent phase leading to CD4 and CD8 upregulation, then proliferative arrest, and TCRα rearrangement. b. Stage-specific patterns of expression of important transcription factor genes are shown below the developmental stages. The color intensity variations provide an approximation of the dynamic changes in expression of the genes, grouped together based on similar expression patterns although not necessarily similar levels; for more accurate quantitation of gene expression, see sources of this figure in Zhang et al. and ImmGen, (www.immgen.org). The transcription factor genes are divided into legacy stem and progenitor genes that are mostly turned off in Phase 1 and are all off by β-selection (blue bars), and genes that are critical to different aspects of the T-cell specification and commitment programs (red bars). Additional information about each of these genes is provided in Tables 1 and 2.
Figure 2
Figure 2. T-lineage commitment and alternative lineage potentials
Diagram of early T-cell development for αβT-cells from bone marrow prethymic progenitors to entry into and development in the thymus, showing the stages from which alternative lineages can develop. The figure shows which fates can be accessed by cells in the presence of Notch signaling (upward pointing arrows), including γδT-lineage cells that can develop from DN2a/b and DN3 cells (brown arrows), as well as those fates that can only be accessed by experimental withdrawal from Notch signaling (downward pointing arrows). Arrows shown emerging from the thymus show conditional outcomes usually only observed if the cells are removed from the thymic environment. Alternative non-T-lineage innate lymphocytes (ILC2) can be generated from bone marrow precursors, as well as ETP and DN2 cells, but only in the presence of Notch ligands and specific cytokines. In the absence of Notch ligands, B-cells can be generated from bone marrow precursors and a subset of the earliest (Flt3+) ETP cells, while dendritic cells (DC) and granulocytes (Gr) or macrophages (Mac), can be derived from prethymic progenitors as well as from thymic ETP cells and to a lesser extent from DN2a cells, but not from later stage cells. Natural killer (NK) cells also develop well from prethymic, ETP and DN2a cells, but not from later stage cells. Broken-line arrows denote potentials seen in low-frequency precursors within a population. Shown also are some key transcription factors that are critical for specific transitions (see text and Fig. 3).
Figure 3
Figure 3. Progression of gene regulatory network states in T-cell commitment: current model
Panels a-f (clockwise progression) show a model of the sequential changes in regulatory relationships between the genes, based on evidence discussed in the text, from the early Flt3+ ETP stage (a) through commitment (c-d) to β-selection (f). Passage through the indicated changes in gene network states (a-f) occurs during periods that correspond approximately to developmental stages, as defined by cell-surface markers, which are indicated at the top of each panel, but the regulatory states may not be homogeneously equivalent to these stages. Phase 1: panels a, b. Transition to phase 2: panel c. Phase 2: panels d, e, in which panel d emphasizes the regulatory gene expression changes and panel E emphasizes the consequences of those changes. Phase 3, post β-selection (for αβT lineage): panel f. Boxes enclose genes that operate coordinately at a given stage even if the details of regulation that link them are not known. Arrows indicate activation. Lines ending in bars indicate repression. Dashed lines indicate “soft repression” which limits the maximal activity or deployment of a transcription factor but does not silence its expression. Dotted lines: likely but undemonstrated linkages. Faded colors: decreasing expression or functional impact of a given gene or gene group as a result of regulatory effects shown elsewhere in the panel. (Id2), potential for activation of Id2 in response to cytokine signaling or other stimuli, which is held in check by Bcl11b. Note that E2A/HEB heterodimers can play a positive role in Gata3 and Tcf7 induction as well as exerting restraint on maximum levels of Gata3 expression. TCR recombination and assembly genes steeply increase in expression from DN2a to DN3a, but are most functionally significant in DN3a. As revealed by T-ALL phenotypes, cells that take a “short cut” from the states represented in panels a-b to the activation events in panel f, bypassing the commitment process, are susceptible to oncogenic transformation. For details, see text.

References

    1. Rothenberg EV, Moore JE, Yui MA. Launching the T-cell-lineage developmental programme. Nat Rev Immunol. 2008;8:9–21. - PMC - PubMed
    1. Petrie HT, Zúñiga-Pflücker JC. Zoned out: functional mapping of stromal signaling microenvironments in the thymus. Annu Rev Immunol. 2007;25:649–679. - PubMed
    1. Thompson PK, Zúñiga-Pflücker JC. On becoming a T cell, a convergence of factors kick it up a Notch along the way. Semin Immunol. 2011;23:350–9. - PubMed
    1. Yang Q, Jeremiah Bell J, Bhandoola A. T-cell lineage determination. Immunol Rev. 2010;238:12–22. - PMC - PubMed
    1. Koch U, Radtke F. Mechanisms of T cell development and transformation. Annu Rev Cell Dev Biol. 2011;27:539–62. - PubMed

Publication types

MeSH terms