. 2014 Sep;34(9):1942-1952.
doi: 10.1161/ATVBAHA.114.303342. Epub 2014 Jul 24.

Induction of lysosomal biogenesis in atherosclerotic macrophages can rescue lipid-induced lysosomal dysfunction and downstream sequelae

Affiliations

Induction of lysosomal biogenesis in atherosclerotic macrophages can rescue lipid-induced lysosomal dysfunction and downstream sequelae

Roy Emanuel et al. Arterioscler Thromb Vasc Biol. 2014 Sep.

Abstract

Objective: Recent reports of a proatherogenic phenotype in mice with macrophage-specific autophagy deficiency have renewed interest in the role of the autophagy-lysosomal system in atherosclerosis. Lysosomes have the unique ability to process both exogenous material, including lipids and autophagy-derived cargo such as dysfunctional proteins/organelles. We aimed to understand the effects of an atherogenic lipid environment on macrophage lysosomes and to evaluate novel ways to modulate this system.

Approach and results: Using a variety of complementary techniques, we show that oxidized low-density lipoproteins and cholesterol crystals, commonly encountered lipid species in atherosclerosis, lead to profound lysosomal dysfunction in cultured macrophages. Disruptions in lysosomal pH, proteolytic capacity, membrane integrity, and morphology are readily seen. Using flow cytometry, we find that macrophages isolated from atherosclerotic plaques also display features of lysosome dysfunction. We then investigated whether enhancing lysosomal function can be beneficial. Transcription factor EB (TFEB) is the only known transcription factor that is a master regulator of lysosomal biogenesis although its role in macrophages has not been studied. Lysosomal stress induced by chloroquine or atherogenic lipids leads to TFEB nuclear translocation and activation of lysosomal and autophagy genes. TFEB overexpression in macrophages further augments this prodegradative response and rescues several deleterious effects seen with atherogenic lipid loading as evidenced by blunted lysosomal dysfunction, reduced secretion of the proinflammatory cytokine interleukin-1β, enhanced cholesterol efflux, and decreased polyubiquitinated protein aggregation.

Conclusions: Taken together, these data demonstrate that lysosomal function is markedly impaired in atherosclerosis and suggest that induction of a lysosomal biogenesis program in macrophages has antiatherogenic effects.

Keywords: atherosclerosis; autophagy; inflammasome; lipid metabolism; lysosomes; macrophages.


Figures

Figure 1
Figure 1. Atherogenic Lipids Alter Lysosome Morphology and Function
(A,B) Confocal microscopy of PMACs loaded with oxidized LDL (oxLDL, 50 mg/mL) or cholesterol crystal (CC, 500 mg/mL), and stained with LAMP1 antibody. Lysosome diameter was quantified from n=25 cells. (C,D) FACS analysis of PMACs treated with (C) oxLDL or (D) CC and stained with LysoTracker Red (200 nM). (E) Measurement of lysosomal pH after specified lipid treatment with 50 nM LysoSensor Yellow/Blue. Changes in pH were quantified as the ratio of emission at 530 nm to emission at 460 nm (n=8–10 wells for each treatment). (F) FACS analysis of PMACs loaded with 10 kDa TMR-dextran (25 mg/mL) followed by oxLDL or CC. (G,H) FACS analysis of PMACs loaded with DQ-ovalbumin (10 mg/mL) and treated with (G) oxLDL or (H) CC. For (C,F,G), mean fluorescence intensity for each peak was determined and expressed as a percentage of control (untreated cells). For (D,H) mean fluorescence intensity of the CC-containing cells (subpopulation with lower intensity peak) was determined and expressed as a percentage control (untreated cells). Representative results of at least three independent experiments are shown. For (B,E), graphs show the mean +/− SEM (*p<0.05).
Figure 2
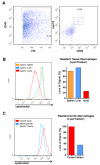
Figure 2. Atherosclerotic Plaque Macrophages Display Lysosomal Dysfunction
(A) FACS gating Strategy to isolate live CD45+/merTK+/CD64+ resident macrophages from mouse tissues. (B) FACS analysis of spleen, liver, and aortic resident macrophages isolated from pooled tissue (n=3) atherosclerotic (ApoE−/−) mice after 2 months of Western Diet and stained with LysoTracker Red (200 nM). (C) FACS analysis of aortic resident macrophages isolated from pooled tissue (n=3) wild-type and atherosclerotic (ApoE−/−) mice after 2 months of Western Diet and stained with LysoTracker Red. For all bar graphs, mean fluorescence intensity for each peak was determined and expressed as a percentage of Lysotracker staining in splenic macrophages (B) or macrophages from wild-type (non-atherosclerotic) aorta (C). Representative results of at least three independent experiments are shown.
Figure 3
Figure 3. Lysosomal Stress Promotes TFEB Nuclear Translocation and Transcriptional Activation of Lysosomal-Autophagy Genes
(A) Quantitative PCR of PMACs either untreated (0 time-point) or treated with chloroquine, oxLDL, or cholesterol crystals for 3 and 12 hours. The transcription of a cohort of autophagy and lysosomal genes is expressed as fold over untreated cells (n=2–4 wells for each treatment). Graphs show the mean +/− SEM (*p<0.05). (B) Confocal microscopy of PMACs treated for 3 hours with the lysosomal inhibitor chloroquine (10 mm), oxidized LDL (50 mg/mL), or cholesterol crystals (500 mg/mL), and stained with TFEB antibody and DAPI (nuclei). Representative results of at least three independent experiments are shown.
Figure 4
Figure 4. Macrophage Lysosomal Biogenesis is Induced by TFEB Overexpression and rescues the Lysosomal Dysfunction Mediated by Atherogenic Lipids
(A) Schema outlining method of macrophage TFEB overexpression in transgenic mice. (B) Quantitative PCR of PMACs derived from macrophage-specific TFEB transgenic mice (n=2–4 wells for each treatment). Graph shows the mean +/− SEM (*p<0.05). (C) FACS analysis of control and TFEB-overexpressing PMACs for LAMP1 expression. (D) FACS analysis of control and TFEB-overexpressing PMACs treated with cholesterol crystals (CC, 500 mg/mL) for 48 hours. (E) Mean fluorescence intensity for each peak was determined and expressed as a percentage of untreated cells (No Tx). Representative results of at least three independent experiments are shown.
Figure 5
Figure 5. TFEB Overexpression Enhances Cholesterol Efflux
(A) Cholesterol efflux to ApoA1 (100 mg/ml) in control and TFEB-overexpressing (TFEB-Tg) macrophages loaded with Acetylated LDL for the indicated times. (B) Quantitative PCR of a set of genes involved in cholesterol efflux, and (C) Lysosomal Acid Lipase (LIPA) activity from control and TFEB-Tg macrophages. (D) Cholesterol efflux to ApoA1 in control and TFEB-Tg macrophages at 24 hours treated concomitantly with Lalistat (an inhibitor of LIPA). (E) Cholesterol efflux to ApoA1 in control, ATG5-deficient (ATG5-KO), and dual ATG5-deficient/TFEB-overexpressing macrophages (ATG5-KO/TFEBTg) for the indicated times. All graphs reflect n=2–4 wells for each treatment and show the mean +/− SEM (*p<0.05, NS = not significant). Representative results of at least three independent experiments are shown.
Figure 6
Figure 6. TFEB Overexpression Reduces Cholesterol Crystal-mediated Inflammasome Activation and Cytoplasmic Inclusion Body Formation
(A–C) ELISA of secreted IL-1β in the media of (A) control and TFEB-overexpressing (TFEB-Tg) PMACs treated with LPS (200 ng/ml) +/− cholesterol crystals (500 mg/mL) for 24 hours, (B) LPS +/− ATP for 2 hours, or (C) ATG5-deficient (ATG5-KO) and ATG5-KO/TFEB-Tg PMACs treated with LPS +/− cholesterol crystals for 24 hours. Cell lysates from respective treatments in (A) and (B) were also subjected to immunoblot for pro-IL-1β. (D) Confocal microscopy of control and TFEB-Tg PMACs loaded with cholesterol crystals (500 mg/ml) and stained with DAPI and antibodies against polyubiquitinated proteins and p62. (E) the number of p62+ aggregates were quantified in macrophages (n=25) imaged in (D). (F) Total p62 levels were determined by measurement of total fluorescence intensity. Graphs in (A–C) reflect n=2–4 wells for each treatment and all graphs show the mean +/− SEM (*p<0.05, NS = not significant). Representative results of at least three independent experiments are shown.
Figure 7
Figure 7
Model Depicting Lysosomal Dysfunction in Atherosclerosis and The Benefits of Inducing a Lysosomal Biogenesis Program in Macrophages.

References

    1. Go AS, Mozaffarian D, Roger VL, et al. Executive summary: Heart disease and stroke statistics--2014 update: A report from the american heart association. Circulation. 2014;129:399–410. - PubMed
    1. Libby P, Ridker PM, Hansson GK. Progress and challenges in translating the biology of atherosclerosis. Nature. 2011;473:317–325. - PubMed
    1. Moore KJ, Tabas I. Macrophages in the pathogenesis of atherosclerosis. Cell. 2011;145:341–355. - PMC - PubMed
    1. Levine B, Kroemer G. Autophagy in the pathogenesis of disease. Cell. 2008;132:27–42. - PMC - PubMed
    1. Singh R, Kaushik S, Wang Y, Xiang Y, Novak I, Komatsu M, Tanaka K, Cuervo AM, Czaja MJ. Autophagy regulates lipid metabolism. Nature. 2009;458:1131–1135. - PMC - PubMed

MeSH terms