Review
. 2014 Jan 4:4:283-94.
doi: 10.1016/j.nicl.2013.12.009. eCollection 2014.

Neuroimaging after mild traumatic brain injury: review and meta-analysis

Affiliations
Review

Neuroimaging after mild traumatic brain injury: review and meta-analysis

Cyrus Eierud et al. Neuroimage Clin. .

Abstract

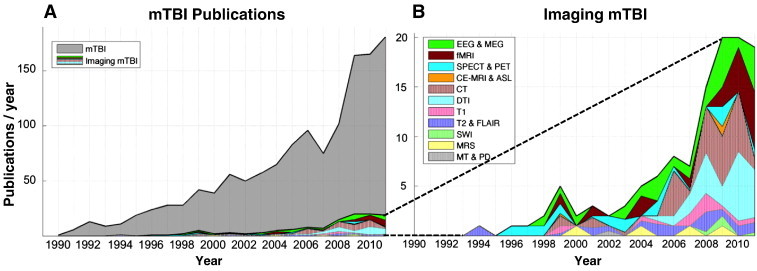
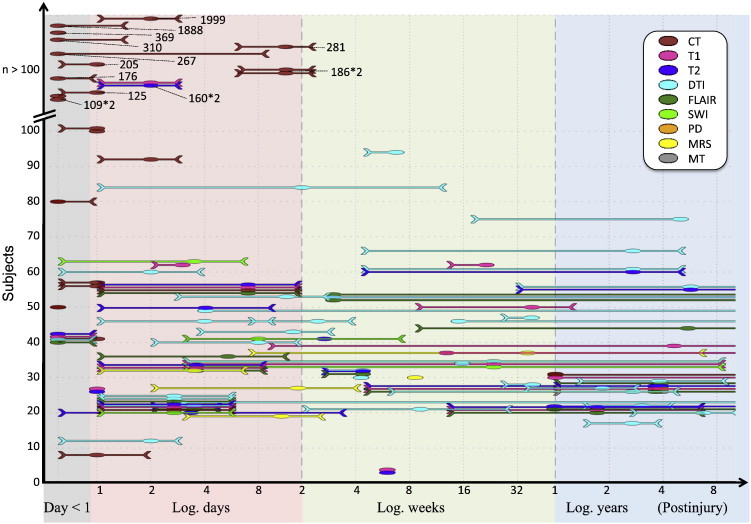
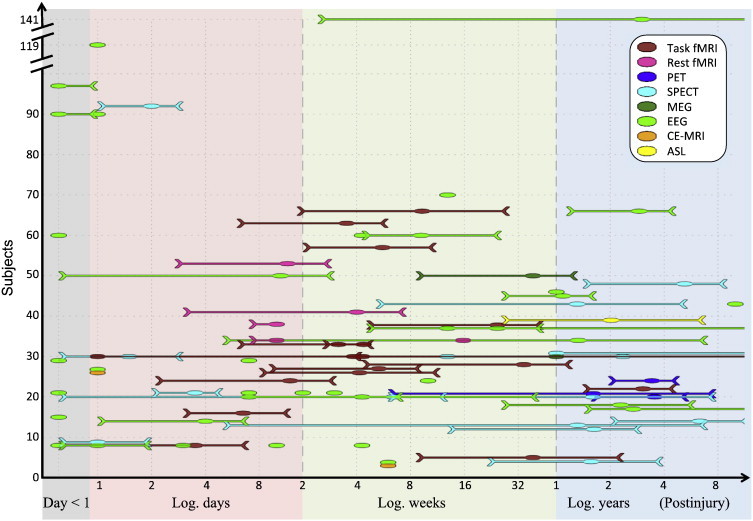
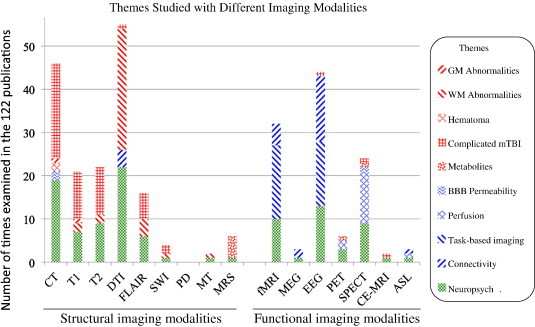
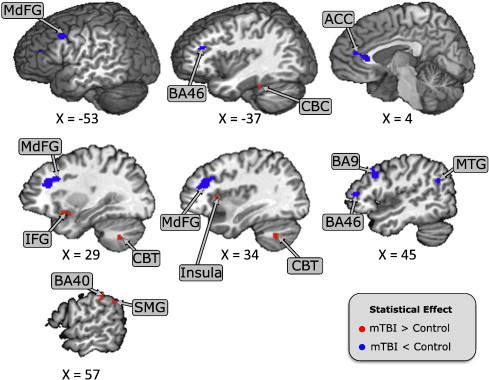
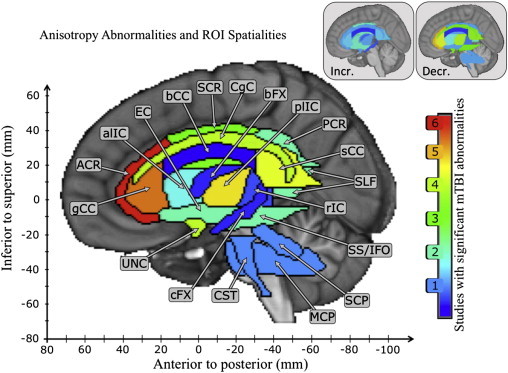
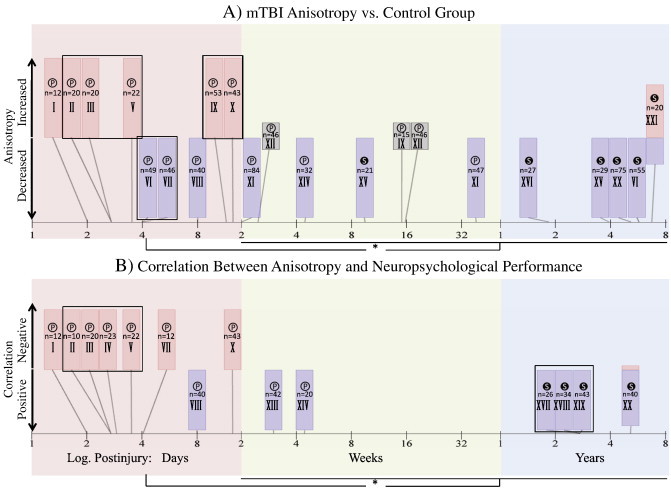
This paper broadly reviews the study of mild traumatic brain injury (mTBI), across the spectrum of neuroimaging modalities. Among the range of imaging methods, however, magnetic resonance imaging (MRI) is unique in its applicability to studying both structure and function. Thus we additionally performed meta-analyses of MRI results to examine 1) the issue of anatomical variability and consistency for functional MRI (fMRI) findings, 2) the analogous issue of anatomical consistency for white-matter findings, and 3) the importance of accounting for the time post injury in diffusion weighted imaging reports. As we discuss, the human neuroimaging literature consists of both small and large studies spanning acute to chronic time points that have examined both structural and functional changes with mTBI, using virtually every available medical imaging modality. Two key commonalities have been used across the majority of imaging studies. The first is the comparison between mTBI and control populations. The second is the attempt to link imaging results with neuropsychological assessments. Our fMRI meta-analysis demonstrates a frontal vulnerability to mTBI, demonstrated by decreased signal in prefrontal cortex compared to controls. This vulnerability is further highlighted by examining the frequency of reported mTBI white matter anisotropy, in which we show a strong anterior-to-posterior gradient (with anterior regions being more frequently reported in mTBI). Our final DTI meta-analysis examines a debated topic arising from inconsistent anisotropy findings across studies. Our results support the hypothesis that acute mTBI is associated with elevated anisotropy values and chronic mTBI complaints are correlated with depressed anisotropy. Thus, this review and set of meta-analyses demonstrate several important points about the ongoing use of neuroimaging to understand the functional and structural changes that occur throughout the time course of mTBI recovery. Based on the complexity of mTBI, however, much more work in this area is required to characterize injury mechanisms and recovery factors and to achieve clinically-relevant capabilities for diagnosis.

Keywords: DTI; Meta-analysis; Mild traumatic brain injury; Neuropsychological assessments; Post concussion syndrome; fMRI.


Figures

Fig. 1
Fig. 1
mTBI publications between 1990 and 2011: The levels of mTBI studies have been increasing over the past two decades and the focus on neuroimaging has increased proportionately with the field as a whole. (A) The histogram shows 1314 mTBI articles published from 1990 to 2011. (B) Focuses on the 122 imaging-based studies, and provides a graphical breakdown of what imaging modalities were used. To date the predominant imaging modalities have been CT and MRI.
Fig. 2
Fig. 2
Structural neuroimaging studies of mTBI vary widely both in terms of the number of subjects studied as well as in the time range from injury. Shown is a graphical depiction of the number of subjects (mTBIs as well as any controls in each experiment) and the time post-injury (for the mTBIs) of data collection for structural imaging studies. The colored backgrounds indicate the time axis scales (days, week, and years). The imaging modality is indicated by color, and each line indicates the study's post-injury scan range (earliest and latest reported times post-injury). The line's ellipse represents the median time after injury. To keep all data “visible,” overlapping lines have been shifted up by two subjects.
Fig. 3
Fig. 3
Functional neuroimaging studies of mTBI also vary widely both in terms of the number of subjects studied as well as the time range after injury. Conventions are the same as in Fig. 2.
Fig. 4
Fig. 4
Two major goals of neuroimaging studies are to find structural and functional markers of mTBI and to establish links between neuropsychological assessments and neuroimaging. Shown is a breakdown of imaging methods and study focus “themes.” Themes include gray matter (GM) abnormalities; white matter (WM) abnormalities; intracranial hematomas; complicated mTBI (non-negative imaging results, excluding hematomas and abnormalities localized to GM and WM such as increased blood brain barrier permeability, contusions, intracranial lesions, and micro bleeds); metabolites (changes in magnetic resonance spectroscopic results); blood brain barrier (BBB) permeability; perfusion deficits; task-based imaging; connectivity analysis; and neuropsychological assessments (used in conjunction with a neuroimaging modality).
Fig. 5
Fig. 5
Activation Likelihood Estimate (ALE) analysis of fMRI mTBI publications shows both increased and decreased BOLD response for mTBI. As shown, mTBI has increased response in cerebellum, insula, and inferior parietal regions (BA 40) compared to controls. Relative to mTBI, control subjects have increased response in several regions in frontal lobe and BA 39. Maps are thresholded at p < 0.05 using a false discovery rate (FDR) correction, and a minimal cluster size of 64 μL. Results are displayed on a Talairach brain template.
Fig. 6
Fig. 6
Shown are the ICBM-81 white matter regions, colored to indicate the number of publications reporting white matter abnormalities (regions with no abnormal findings in the literature are not shown). The Montreal Neurological Institute (MNI-152) template is added for anatomical reference. Using the center-of-mass for each ICBM-81 structure, we determined that a significant anterior-to-posterior relationship exists between frequency in the literature and anatomical location. See Table 2 for full names of the anatomical labels. Note that since more lateral structures are only partially visible, the anatomical labels point to a convenient, visible location and do not necessarily reflect a structure's center of mass. For example, SLF is mostly covered by more medial structures, and is only visible at its most posterior-inferior part. Coordinates are displayed in MNI-152 space.
Fig. 7
Fig. 7
(A) Elevated anisotropy, for mTBI, is more frequently reported for studies of acute mTBI, while depressed anisotropy is reported more frequently for studies after the acute phase. Each bar represents the ratio of increased (red) to decreased (blue) regions in mTBI vs. a control group for each publication. The gray boxes represent experiments with insignificant FA difference between mTBI and control groups. The lines connecting the bars to the time axis mark the study's median time post-injury. Also indicated is the number of subjects per experiment and whether the mTBI subjects were prospective (P) or selected (S). Boxed bars indicate potentially overlapping subject cohorts. The colored backgrounds indicate the time axis scales (days, weeks, and years). For statistical tests, we have defined post-injury times less than 14 days as an acute mTBI, and post-acute times as 2 weeks and greater. Based on a one-sided, two-sample t-test, the acute anisotropy was significantly greater than the anisotropy after the acute phase (p = 0.02). (B) Shows the analogous information for studies that reported significant relationships between anisotropy measures and neuropsychological performance. Using a t-test analogous to that in 7A, we show that the acute phase anisotropy was significantly anti-correlated with neuropsychological performance compared to a predominant positive correlation after the acute phase (p < 0.006). Statistical significance was designated as * for p < 0.05. Publications are I) Bazarian et al. (2007); II) Chu et al. (2010); III) Wilde et al. (2008); IV) Wu et al. (2010); V) Yallampalli et al. (2010); VI) Inglese et al. (2005); VII) Miles et al. (2008); VIII) Lipton et al. (2009); IX) Mayer et al. (2011); X) Mayer et al. (2010); XI) Messe et al. (2011); XII) Mac Donald et al. (2011); XIII) Holli et al. (2010); XIV) Smits et al. (2011); XV) Grossman et al. (2012); XVI) Lipton et al. (2008); XVII) Maruta et al. (2010); XVIII) Niogi et al. (2008a); XIX) Niogi et al. (2008b); XX) Geary et al. (2010); XXI) Lo et al. (2009).

References

    1. Adams J.H., Graham D.I., Scott G., Parker L.S., Doyle D. Brain damage in fatal non-missile head injury. J. Clin. Pathol. 1980;33:1132–1145. - PMC - PubMed
    1. Alexander M.P. Mild traumatic brain injury: pathophysiology, natural history, and clinical management. Neurology. 1995;45:1253–1260. - PubMed
    1. American Psychiatric Association . Fourth edition. American Psychiatric Association; Washington, DC: 2000. Diagnostic and Statistical Manual of Mental Disorders; pp. 760–762. (Text Revision)
    1. Arciniegas D.B., Anderson C.A., Topkoff J., McAllister T.W. Mild traumatic brain injury: a neuropsychiatric approach to diagnosis, evaluation, and treatment. Neuropsychiatr. Dis. Treat. 2005;1:311–327. - PMC - PubMed
    1. Bazarian J.J., Zhong J., Blyth B., Zhu T., Kavcic V. Diffusion tensor imaging detects clinically important axonal damage after mild traumatic brain injury: a pilot study. J. Neurotrauma. 2007;24:1447–1459. - PubMed

MeSH terms