. 2014 Sep;124(9):3960-74.
doi: 10.1172/JCI75392. Epub 2014 Jul 25.

Lymphatic regulator PROX1 determines Schlemm's canal integrity and identity

Lymphatic regulator PROX1 determines Schlemm's canal integrity and identity

Dae-Young Park et al. J Clin Invest. 2014 Sep.

Abstract

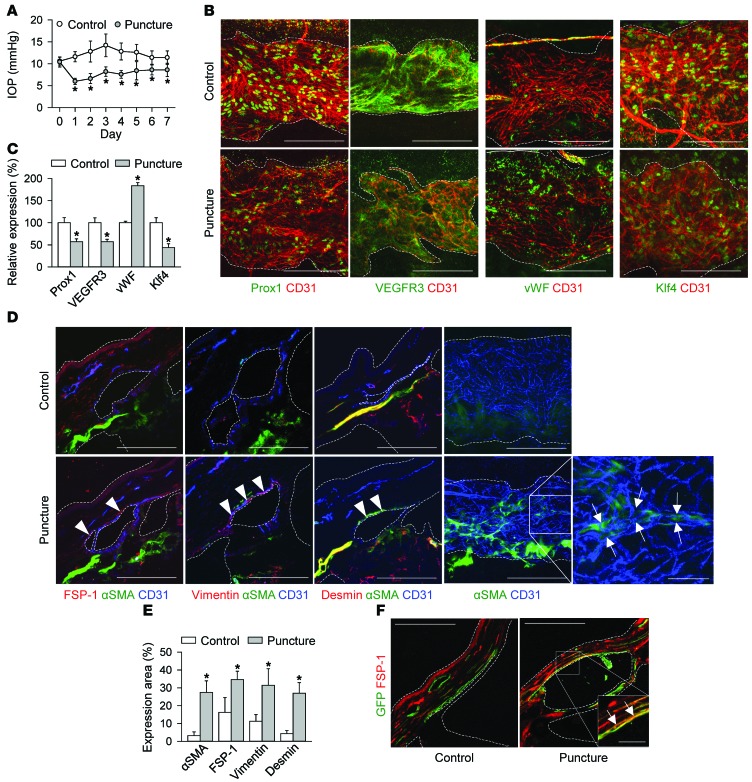
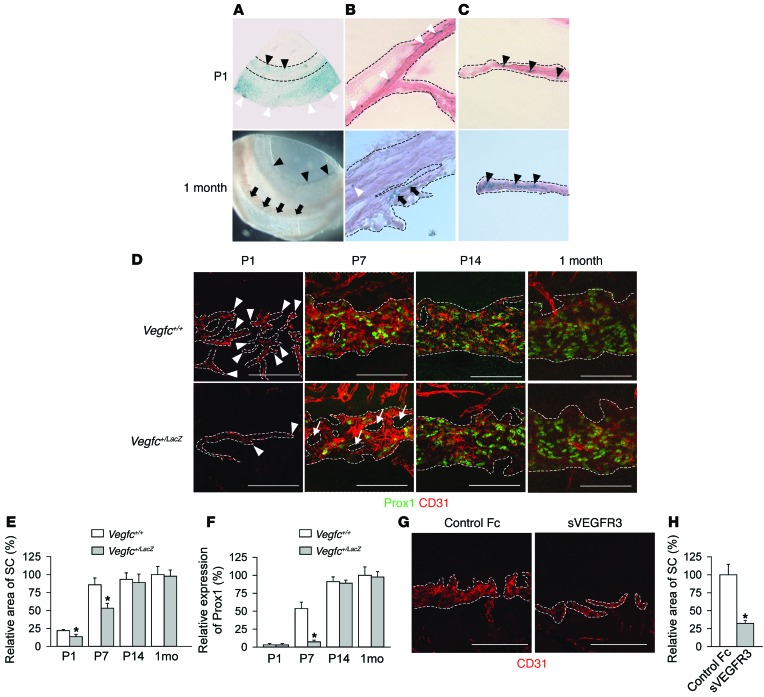
Schlemm's canal (SC) is a specialized vascular structure in the eye that functions to drain aqueous humor from the intraocular chamber into systemic circulation. Dysfunction of SC has been proposed to underlie increased aqueous humor outflow (AHO) resistance, which leads to elevated ocular pressure, a factor for glaucoma development in humans. Here, using lymphatic and blood vasculature reporter mice, we determined that SC, which originates from blood vessels during the postnatal period, acquires lymphatic identity through upregulation of prospero homeobox protein 1 (PROX1), the master regulator of lymphatic development. SC expressed lymphatic valve markers FOXC2 and integrin α9 and exhibited continuous vascular endothelial-cadherin (VE-cadherin) junctions and basement membrane, similar to collecting lymphatics. SC notably lacked luminal valves and expression of the lymphatic endothelial cell markers podoplanin and lymphatic vessel endothelial hyaluronan receptor 1 (LYVE-1). Using an ocular puncture model, we determined that reduced AHO altered the fate of SC both during development and under pathologic conditions; however, alteration of VEGF-C/VEGFR3 signaling did not modulate SC integrity and identity. Intriguingly, PROX1 expression levels linearly correlated with SC functionality. For example, PROX1 expression was reduced or undetectable under pathogenic conditions and in deteriorated SCs. Collectively, our data indicate that PROX1 is an accurate and reliable biosensor of SC integrity and identity.


Figures

Figure 9
Figure 9. Schematic diagram depicting the dynamic changes of lymphatic identities of SC during development, adulthood, and senescence.
SC ECs are postnatally transdifferentiated from BECs (VEGFR2+, Tie2+, and Prox1) to acquire lymphatic phenotypes by the upregulation of Prox1 and increased AHO. With ageing, senescent SC ECs, which by then have reduced AHO, start to lose lymphatic markers (Prox1, VEGFR3, and Itga9), but gain blood vessel markers (vWF) as well as mesenchymal markers (α-SMA, FSP-1, vimentin, and desmin), leading to EndMT.
Figure 8
Figure 8. Aged SC displays reduced lymphatic markers and increased mesenchymal markers.
(A, B, and D) Images and comparisons of expression in Prox1, Prox1-GFP, VEGFR3, Itga9, vWF, FSP-1, α-SMA, and desmin in CD31+ SC of 2-month-old and 1-year-old mice. Arrows indicate Itga9 expression in CD31+ SC. Arrowheads denote CD31+ limbal BVs with desmin coverage. The relative expression of SC at 2 months was normalized to 100%, from which the relative expressions of other groups were calculated. n = 5, each group. *P < 0.05 versus 2 months. (C) Comparisons of Prox1 mRNA expressions in corneal limbus. n = 5, each group. *P < 0.05 versus 2 months. Scale bars: 100 μm.
Figure 7
Figure 7. Aged SC exhibits features of senescent endothelium and reduced AHO.
(AD) Images and comparisons of expressions in SA β-gal, ROS, MMP-2, MMP-9, Klf4, eNOS, and perfused microbead (bead) in SC of 2-month-old and 1-year-old mice. Arrows and arrowheads indicate expressions of MMP-2 and MMP-9, respectively, in CD31+ SC. The relative expression of SC at 2 months was normalized to 100%, from which the relative expressions of other groups were calculated. n = 5, each group. *P < 0.05 versus 2 months. (E) Comparisons of IOP at 2, 6, and 12 months. n = 5, each group. Scale bars: 100 μm.
Figure 6
Figure 6. Analysis of lymphatic identity in SC with defective AHO within bead-induced glaucoma model.
(AE) Eyes were injected with 2 μl of microbeads (bead diameter, 6 μm) or 2 μl of PBS, and corneas were harvested after 7 days. (A) Appearance of a bead-injected eye. Arrows indicate deposited beads adjacent to SC. (B) Comparison of IOP. n = 4, each group. (C) IHC of SC stained for Prox1 and α-SMA in CD31+ SC. Scale bars: 100 μm. (D and E) Comparisons of relative Prox1 expression and of the coverage of α-SMA+ cells by measuring α-SMA+ area divided by CD31+ SC area, expressed as a percentage. The relative expression of PBS was normalized to 100%, from which the relative expressions of other groups were calculated. n = 4, each group. *P < 0.05 versus PBS.
Figure 5
Figure 5. Reduced AHO induces loss of lymphatic feature in SC ECs, leading to EndMT.
(AE) Images and comparisons of SC between punctured eyes and sham-operated control eyes. Eyes were punctured daily for 7 days, and corneas were harvested at day 7. (A) Comparison of IOP. n = 4–5, each group. (B and C) Images and comparisons of expressions of Prox1, VEGFR3, vWF, and Klf4 in the CD31+ ECs of SC. n = 4–5, each group. The quantification of control group was normalized to 100%, from which the quantifications of other groups were calculated. (D and E) Images and comparisons of mesenchymal markers α-SMA, FSP-1, vimentin, and desmin in CD31+ SC ECs. Solid-line square is magnified on the right, which reveals α-SMA expression in the CD31+ EC of SC (white arrows). Arrowheads indicate expression of FSP-1, vimentin, and desmin in CD31+ SC ECs, respectively. n = 4–5, each group. (F) Lineage-tracing study in which Prox1-CreERT2 R26mTmG mice were treated with tamoxifen 3 times from 8 weeks. Then eyes were punctured daily for 7 days, and corneas were harvested at day 7. Solid-line square is magnified in the bottom right corner. Arrows indicate coexpression of FSP-1 in GFP+ SC ECs. *P < 0.05 versus control. Scale bars: 100 μm; 20 μm (enlarged squares).
Figure 4
Figure 4. VEGF-C/VEGFR3 system plays a crucial role in the early development of SC.
(AC) β-Gal staining of corneas in VEGF-C–β-gal knockin reporter mice (Vegfc+/LacZ) at P1 and 1 month. Robust VEGF-C expression in superficial layer of cornea (white arrowhead) and iris (black arrowhead) at P1 is shown, while rarer VEGF-C expression in TM (black arrow) and iris (black arrowhead) at 1 month is shown. (D) Prox1 and CD31 staining of SC ECs in Vegfc+/LacZ and Vegfc+/+ mice during postnatal development. Arrowheads indicate buddings of SC ECs. Arrows indicate holes in SC, which denote defects of tubular fusion. (E and F) Comparisons of relative area and Prox1 expression of SC. The area and Prox1 expression of Vegfc+/+ at 1 month was set as 100%, respectively. n = 4, each group. *P < 0.05 versus Vegfc+/+. (G and H) Mice were i.p. given sVEGFR3 (25 mg/kg) daily from P1 to P6 and designated as control Fc and sVEGFR3; corneas were harvested at P7. (G) Image showing CD31+ SC ECs. (H) Comparison of relative SC area. The quantification of control Fc group was normalized to 100%, from which the quantifications of other groups were calculated. n = 4, each group. *P < 0.05 versus control Fc. Scale bars: 100 μm.
Figure 3
Figure 3. AHO determines the expansion of SC ECs during postnatal development.
Unless otherwise noted, the relative SC area and expression in control was normalized to 100%, from which the relative expressions of other groups were calculated. n = 4, each group. (AE) Images and comparisons of the SC between punctured eyes and control eyes. Eyes were punctured at P6 and harvested at P7. (A and D) Images showing the expression of PH3, caspase-3, Klf4, and Prox1 in SC. (B, C, and E) Comparison of numbers of PH3+ cells and caspase-3+ cells, and relative expressions of Klf4 and Prox1 in SC. (FI) Eyes of WT and Prox1-GFP mice were treated with control buffer (control) or Cosopt (B&C) daily from P5 to P7, and corneas were harvested at P7. (F) Comparison of IOP. (G) Images showing expression of Prox1-GFP and Prox1 in SC. (H and I) Comparison of relative SC area and expression of Prox1-GFP and Prox1. (JM) Images and comparisons of the SC between injected eyes (injection) and sham-operated eyes (control). Eyes were injected with donor aqueous humor at P6 and harvested at P7. (J) Comparison of IOP. (K) Images showing Prox1 and VEGFR3 expression in SC. (L and M) Comparison of relative SC area and expression of Prox1 and VEGFR3 in SC. Scale bars: 50 μm. *P < 0.05 versus control.
Figure 2
Figure 2. Acquisition of lymphatic characteristics in SC dependent on AHO during postnatal development.
Unless otherwise noted, for the bar graphs, the quantification of the control group was normalized to 100%, from which the quantifications of other groups were calculated. (A and B) Temporal changes and quantifications of SC area and expression of Prox1, VEGFR2, VEGFR3, and Tie2 in SC during postnatal development. Dashed lines indicate the buds of SC derived from the CVs. Arrowheads demarcate the remnant communication between SC and CVs. Mean ± SD are shown (n = 4). Scale bars: 50 μm. For the quantifications, the group with the highest value was normalized to 100%, from which the relative values of other groups are shown. (C) Schematic diagram showing generation of the ocular puncture. Upper panel: a puncture on the sclera through 31-gauge syringe needle; lower panel: reduction of AHO achieved by leakage through the puncture. (DG) Images and comparisons of the SC between the punctured eyes (puncture) and the sham-operated control eyes. Eyes were punctured from P5 to P6, and the corneas were harvested at P7. (D) Comparison of IOP. Each group, n = 4–5. (E) Images showing Prox1+, Prox1-GFP+, or VEGFR3+ cells in CD31+ SC. Arrowheads indicate the remnant communication between SC and CVs. Scale bars: 100 μm. (F and G) Comparisons of relative area and expressions of Prox1, Prox1-GFP, and VEGFR3 in SC. Each group, n = 4–5. *P < 0.05 versus control.
Figure 1
Figure 1. SC drains out aqueous humor into BVs and exhibits lymphatic markers but does not perfectly match the features of terminally differentiated LVs.
(A) Schematic diagram of cornea showing SC (light green), AV (dark green), limbal LVs (light blue), and BVs (red). The square portion, immunostained and highly magnified, is shown in B. (B and C) Image and schematic diagram showing Prox1-GFP+ SC, AV, and CD31+ BV networks. Dashed lines demarcate limbal LV and AV, while dashed arrows indicate the AHO from SC into BVs. (D) H&E staining of corneal limbus in section. Arrow indicates SC. (E) Cross-sectioned image showing Prox1-GFP+ SC, PDGFR-β+ TM, and α-SMA+ CM in corneal limbus. (F) Perfused red fluorescent microbeads (diameter, 1 μm) in Prox1-GFP+ SC. Prox1-GFP mice were given 0.5 μl of the microbeads by intraocular injection; sample was harvested after 1 hour. (G) Image showing VEGFR3 expression in CD31+ SC. (H) Cross-sectioned image showing Itga9 (arrowhead), CD31+ SC, and α-SMA+ CM in corneal limbus. Magnification of the square portion is shown in the top right corner. (I) Comparison of expression and distribution of endomucin between SC (left panel) and limbal LVs (right panel). Arrows indicate limbal veins, while arrowheads indicate limbal artery. (JL) Comparisons of expressions and distributions of podoplanin, VE-cadherin, Prox1-GFP, LYVE-1, and collagen IV+ basement membrane between SC (upper panels) and limbal LVs (lower panels). Dashed lines demarcate SC or limbal LVs (IL).The square portions are magnified on the right. Scale bars: 100 μm; 20 μm (enlarged squares).

Comment in

References

    1. Ramos RF, Hoying JB, Witte MH, Stamer WD. Schlemm’s canal endothelia, lymphatic, or blood vasculature? J Glaucoma. 2007;16(4):391–405. doi: 10.1097/IJG.0b013e3180654ac6. - DOI - PubMed
    1. Gabelt BT, Kaufman PL. Changes in aqueous humor dynamics with age and glaucoma. Prog Retin Eye Res. 2005;24(5):612–637. doi: 10.1016/j.preteyeres.2004.10.003. - DOI - PubMed
    1. Lei Y, Overby DR, Boussommier-Calleja A, Stamer WD, Ethier CR. Outflow physiology of the mouse eye: pressure dependence and washout. Invest Ophthalmol Vis Sci. 2011;52(3):1865–1871. doi: 10.1167/iovs.10-6019. - DOI - PMC - PubMed
    1. Fan BJ, Wiggs JL. Glaucoma: genes, phenotypes, and new directions for therapy. J Clin Invest. 2010;120(9):3064–3072. doi: 10.1172/JCI43085. - DOI - PMC - PubMed
    1. Alm A, Nilsson SF. Uveoscleral outflow — a review. Exp Eye Res. 2009;88(4):760–768. doi: 10.1016/j.exer.2008.12.012. - DOI - PubMed

Publication types

MeSH terms

Substances