Crime and psychiatric disorders among youth in the US population: an analysis of the National Comorbidity Survey-Adolescent Supplement
- PMID: 25062596
- PMCID: PMC4137504
- DOI: 10.1016/j.jaac.2014.05.007
Crime and psychiatric disorders among youth in the US population: an analysis of the National Comorbidity Survey-Adolescent Supplement
Abstract
Objective: Current knowledge regarding psychiatric disorders and crime in youth is limited to juvenile justice and community samples. This study examined relationships between psychiatric disorders and self-reported crime involvement in a sample of youth representative of the US population.
Method: The National Comorbidity Survey-Adolescent Supplement (N = 10,123; ages 13-17 years; 2001-2004) was used to examine the relationship between lifetime DSM-IV-based diagnoses, reported crime (property, violent, other), and arrest history. Logistic regression compared the odds of reported crime involvement with specific psychiatric disorders to those without any diagnoses, and examined the odds of crime by psychiatric comorbidity.
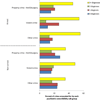
Results: Prevalence of crime was 18.4%. Youth with lifetime psychiatric disorders, compared to no disorders, had significantly greater odds of crime, including violent crime. For violent crime resulting in arrest, conduct disorder (CD) (odds ratio OR = 57.5; 95% CI = 30.4, 108.8), alcohol use disorders (OR = 19.5; 95% CI = 8.8, 43.2), and drug use disorders (OR = 16.1; 95% CI = 9.3, 27.7) had the greatest odds with similar findings for violent crime with no arrest. Psychiatric comorbidity increased the odds of crime. Youth with 3 or more diagnoses (16.0% of population) accounted for 54.1% of those reporting arrest for violent crime. Youth with at least 1 diagnosis committed 85.8% of crime, which was reduced to 67.9% by removing individuals with CD. Importantly, 88.2% of youth with mental illness reported never having committed any crime.
Conclusion: Our findings highlight the importance of improving access to mental health services for youthful offenders in community settings, given the substantial associations found between mental illness and crime in this nationally representative epidemiological sample.
Keywords: US population; arrest; crime; psychiatric disorders; youth.
Copyright © 2014 American Academy of Child and Adolescent Psychiatry. Published by Elsevier Inc. All rights reserved.
Conflict of interest statement
Disclosure: Drs. Coker, Smith, and Zonana report no biomedical financial interests or potential conflicts of interest.
Figures


References
-
- Elbogen EB, Johnson SC. The intricate link between violence and mental disorder: results from the National Epidemiologic Survey on Alcohol and Related Conditions. Arch Gen Psychiatry. 2009;66(2):152–161. - PubMed
-
- Van Dorn R, Volavka J, Johnson N. Mental disorder and violence: is there a relationship beyond substance use. Soc Psychiatry Psychiatr Epidemiol. 2012;47(3):487–503. - PubMed
-
- Swanson JW, Holzer CE, 3rd, Ganju VK, Jono RT. Violence and psychiatric disorder in the community: evidence from the Epidemiologic Catchment Area surveys. Hosp Community Psychiatry. 1990;41(7):761–770. - PubMed
-
- Vinkers DJ, de Beurs E, Barendregt M, Rinne T, Hoek HW. The relationship between mental disorders and different types of crime. Criminal Behaviour and Mental Health. 2011;21(5):307–320. - PubMed
-
- Link BG, Stueve A. In: Psychotic Symptoms and the Violent/Illegal Behavior of Mental Patients Compared to Community Controls From Violence and Mental Disorder: Developments in Risk Assessment. Monahan John, Steadman Henry J., editors. United States: 1994. pp. 137–159. See NCJ-165556.; 1994.
Publication types
MeSH terms
Grants and funding
LinkOut - more resources
Full Text Sources
Other Literature Sources
Medical

