. 2015 Nov;220(6):3167-84.
doi: 10.1007/s00429-014-0849-y. Epub 2014 Jul 26.

A predictive model of the cat cortical connectome based on cytoarchitecture and distance

Affiliations

A predictive model of the cat cortical connectome based on cytoarchitecture and distance

Sarah F Beul et al. Brain Struct Funct. 2015 Nov.

Abstract

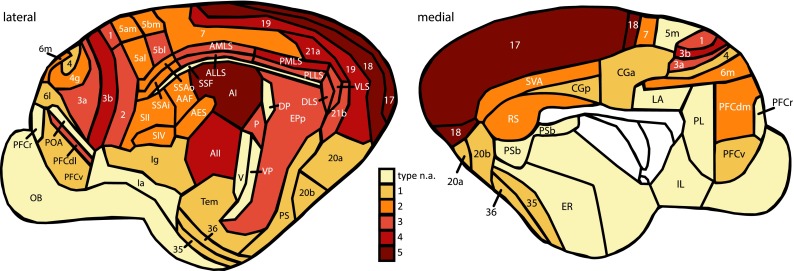
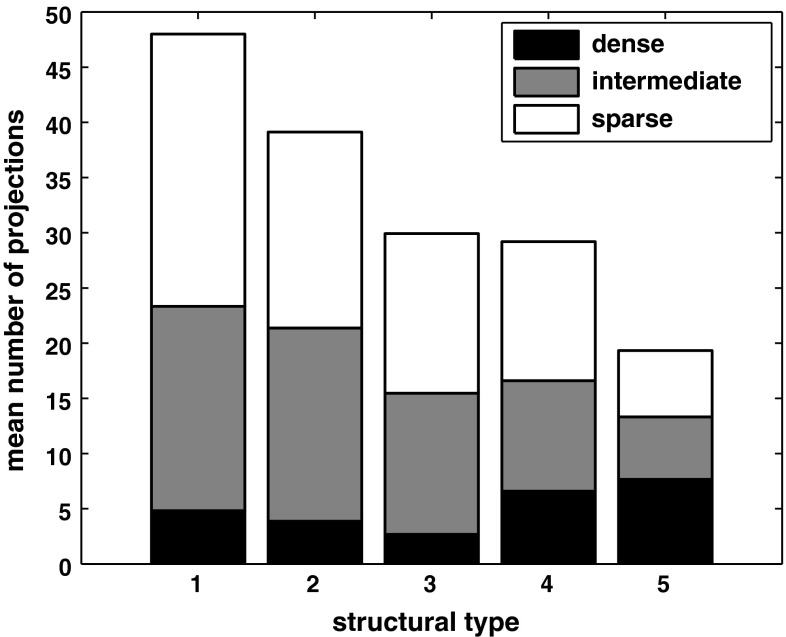
Information processing in the brain is strongly constrained by anatomical connectivity. However, the principles governing the organization of corticocortical connections remain elusive. Here, we tested three models of relationships between the organization of cortical structure and features of connections linking 49 areas of the cat cerebral cortex. Factors taken into account were relative cytoarchitectonic differentiation ('structural model'), relative spatial position ('distance model'), or relative hierarchical position ('hierarchical model') of the areas. Cytoarchitectonic differentiation and spatial distance (themselves uncorrelated) correlated strongly with the existence of inter-areal connections, whereas no correlation was found with relative hierarchical position. Moreover, a strong correlation was observed between patterns of laminar projection origin or termination and cytoarchitectonic differentiation. Additionally, cytoarchitectonic differentiation correlated with the absolute number of corticocortical connections formed by areas, and varied characteristically between different cortical subnetworks, including a 'rich-club' module of hub areas. Thus, connections between areas of the cat cerebral cortex can, to a large part, be explained by the two independent factors of relative cytoarchitectonic differentiation and spatial distance of brain regions. As both the structural and distance model were originally formulated in the macaque monkey, their applicability in another mammalian species suggests a general principle of global cortical organization.

Keywords: Anatomical tract tracing; Cerebral cortex; Connectivity; Cytoarchitecture; Neuroinformatics.


Figures

Fig. 1
Fig. 1
Parcellation of the cat cortex, adapted from Scannell et al. (1995). Areas were assigned to structural types 1–5 according to their level of cytoarchitectonic differentiation. Type n.a. no structural type was assigned. Abbreviations as in Online Resource 1
Fig. 2
Fig. 2
Cumulative percentages of present projections. For each anatomical variable, the absolute number of present projections is shown for each of its values (bars, left axis). Additionally, the cumulative percentage of present projections is indicated (diamonds, right axis). a Border distance Δdist. b Absolute type difference |Δtype|. c Absolute hierarchical level difference |Δlevel|
Fig. 3
Fig. 3
Interrelations of anatomical variables. a Distance Δdist was not correlated with absolute structural type difference |Δtype| or b with absolute hierarchical level difference |Δlevel|. c Structural type difference Δtype and hierarchical level difference Δlevel were strongly correlated. Marker size indicates number of projections
Fig. 4
Fig. 4
Correlation of anatomical variables with relative frequencies of present projections. a, b Distance Δdist and absolute structural type difference |Δtype| were negatively correlated with relative projection frequency. c Absolute hierarchical level difference |Δlevel| was not correlated with relative projection frequency
Fig. 5
Fig. 5
Results of linear discriminant analysis (LDA). a Posterior probabilities for presence of projections across the predictive variable space. Black borders enclose ranges of p present > 0.75 and p present <0.25. b Results of cross-validation at different prediction thresholds. Mean prediction accuracy for projections that were predicted to be present and absent (light green) as well as overall mean prediction accuracy (dark green) are shown. Mean number of predictions at each threshold is shown in black. Error bars indicate standard deviations. c Matrix of corticocortical connections in the cat, adapted from Scannell et al. (1995). Projections of known status are coded dark red (absent) and dark blue (present). Additionally, predicted connectivity for 926 unexamined projections is indicated. Projections predicted to be absent are shown in lighter reds, predictions predicted to be present are shown in lighter blues. Color saturation indicates how conservative a prediction threshold a particular prediction survived. White cells are unexamined connections for which no prediction has been made. The diagonal of intra-areal connections has been marked black. Projections’ source regions are arranged on the vertical axis, target regions are arranged on the horizontal axis. Abbreviations as in Online Resource 1. Note that area labels are split across left/top and right/bottom axes
Fig. 6
Fig. 6
Distribution of structural types across modules of cortical areas. a Hub-module areas had a lower median type than non-hub-module areas. b Structural type gradually decreased across four anatomical modules of cortical areas. Markers inside circles indicate median degree, diamonds indicate outliers
Fig. 7
Fig. 7
Degree distribution of cortical areas. a Node degree of cortical areas across structural types. b Weighted node degree of cortical areas across structural types. Node degree was correlated with structural type, while weighted node degree was not. Markers inside circles indicate median degree
Fig. 8
Fig. 8
Mean number of projections across structural types. Means for ordinal projection strengths are indicated separately for each structural type. The maximal standard deviation across all structural types is 5 for the number of dense projections, 7 for the number of intermediate projections, and 9 for the number of sparse projections
Fig. 9
Fig. 9
Correlation of anatomical variables with assigned directionalities of projections. a Structural type difference Δtype was strongly correlated with projection directions and b hierarchical level difference Δlevel. c Hierarchical level difference Δlevel was strongly correlated with projection directions. Marker size indicates number of projections
Fig. 10
Fig. 10
Visualization of the corticocortical connections collated in Scannell et al. (1995). All present projections between cortical areas for which a structural type was defined (49 of 65 areas) are displayed. Circles correspond to structural types, cortical areas are placed accordingly. Structural type increases from center to periphery. Projections are color-coded according to the absolute structural type difference of the connected areas. Ordinal projection strength (sparse, intermediate, or dense) is coded by increasing projection width. Nodes are grouped and color-coded according to anatomical modules as indicated. Node sizes indicate the areas’ (unweighted) degree. Hub-module areas, as classified by Zamora-López et al. (2010), are marked by a white outline

References

    1. Alger JR. The diffusion tensor imaging toolbox. J Neurosci. 2012;32:7418–7428. doi: 10.1523/JNEUROSCI.4687-11.2012. - DOI - PMC - PubMed
    1. Bailey A, Ombuki-Berman B, Ventresca M (2013) Automatic inference of hierarchical graph models using genetic programming with an application to cortical networks. In: Blum C (ed) GECCO’13: Proceedings of 15th annual conference on genetic and evolutionary computation. ACM, New York, pp 893–900
    1. Barbas H. Pattern in the laminar origin of corticocortical connections. J Comp Neurol. 1986;252:415–422. doi: 10.1002/cne.902520310. - DOI - PubMed
    1. Barbas H, Pandya DN. Architecture and intrinsic connections of the prefrontal cortex in the rhesus monkey. J Comp Neurol. 1989;286:353–375. doi: 10.1002/cne.902860306. - DOI - PubMed
    1. Barbas H, Rempel-Clower NL. Cortical structure predicts the pattern of corticocortical connections. Cereb Cortex. 1997;7:635–646. doi: 10.1093/cercor/7.7.635. - DOI - PubMed

Publication types

LinkOut - more resources