. 2014 Nov;12(11):1677-88.
doi: 10.1158/1541-7786.MCR-14-0397-T. Epub 2014 Jul 25.

Targeted deletion and lipidomic analysis identify epithelial cell COX-2 as a major driver of chemically induced skin cancer

Affiliations

Targeted deletion and lipidomic analysis identify epithelial cell COX-2 as a major driver of chemically induced skin cancer

Jing Jiao et al. Mol Cancer Res. 2014 Nov.

Abstract

Pharmacologic and global gene deletion studies demonstrate that cyclooxygenase-2 (PTGS2/COX-2) plays a critical role in DMBA/TPA-induced skin tumor induction. Although many cell types in the tumor microenvironment express COX-2, the cell types in which COX-2 expression is required for tumor promotion are not clearly established. Here, cell type-specific Cox-2 gene deletion reveals a vital role for skin epithelial cell COX-2 expression in DMBA/TPA tumor induction. In contrast, myeloid Cox-2 gene deletion has no effect on DMBA/TPA tumorigenesis. The infrequent, small tumors that develop on mice with an epithelial cell-specific Cox-2 gene deletion have decreased proliferation and increased cell differentiation properties. Blood vessel density is reduced in tumors with an epithelial cell-specific Cox-2 gene deletion, compared with littermate control tumors, suggesting a reciprocal relationship in tumor progression between COX-2-expressing tumor epithelial cells and microenvironment endothelial cells. Lipidomics analysis of skin and tumors from DMBA/TPA-treated mice suggests that the prostaglandins PGE2 and PGF2α are likely candidates for the epithelial cell COX-2-dependent eicosanoids that mediate tumor progression. This study both illustrates the value of cell type-specific gene deletions in understanding the cellular roles of signal-generating pathways in complex microenvironments and emphasizes the benefit of a systems-based lipidomic analysis approach to identify candidate lipid mediators of biologic responses.

Implications: Cox-2 gene deletion demonstrates that intrinsic COX-2 expression in initiated keratinocytes is a principal driver of skin carcinogenesis; lipidomic analysis identifies likely prostanoid effectors.


Conflict of interest statement

Disclosure of Potential Conflict of Interest:

No potential conflicts of interest were disclosed by the authors.

Figures

Figure 1
Figure 1. Epidermal keratinocyte-specific Cox-2 gene deletion reduces DMBA/TPA-induced mouse skin papilloma formation; in contrast myeloid cell-specific Cox-2 deletion has no effect on DMBA/TPA-induced skin tumor induction
(A) DMBA/TPA-induced skin papilloma sections rom a Cox-2fl/fl mouse stained for H&E, COX-2 or F4/80. Scale bars: 50µm. (B) Cox-2ΔE mice (n = 20) and Cox-2fl/fl littermates (n = 17) were subjected to DMBA/TPA skin cancer induction. Left panel, the tumor incidence difference between Cox-2ΔE and their Cox-2fl/fl littermate mice was significant by χ2 test (p<0.05). Right panel, tumor multiplicities; error bars, SEM. Significant differences when comparing these groups were determined by Mann-Whitney U test (p < 0.05–0.001, week 11–20). (C) DMBA/TPA tumor induction in Cox-2ΔM (n = 15) and Cox-2fl/fl littermate mice (n = 15). Error bars, SEM. No significant differences for tumor incidence (χ2 test) or tumor multiplicities (Mann-Whitney U test) were detectable between the groups.
Figure 2
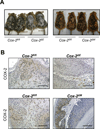
Figure 2. DMBA/TPA-induced tumors of Cox-2ΔE mice are smaller than tumors of Cox-2fl/fl mice, and do not express COX-2 in epithelial tumor cells
(A) Left panel; DMBA/TPA-induced tumors on Cox-2ΔE and littermate Cox-2fl/fl mice (20 weeks of TPA treatment). Right panel; DMBA/TPA-induced tumors on Cox-2ΔM and littermate Cox-2fl/fl mice (20 weeks of TPA treatment). (B) Upper panels; Papillomas from Cox-2ΔE and littermate Cox-2fl/fl mice were stained for COX-2. Lower panels; Papillomas from Cox-2ΔM and littermate Cox-2fl/fl mice were stained for COX-2. Scale bars: 100µm.
Figure 3
Figure 3. Epidermal hyperplasia is reduced in response to DMBA/TPA treatment in Cox-2ΔE mice, but not in Cox-2ΔM mice
(A) Micrographs (Top): H&E stained skin sections from Cox-2ΔE and littermate Cox-2fl/fl mice, either untreated or after 20 weeks of DMBA/TPA treatment. Graph (bottom): Epidermal thickness quantification. Error bars, SD. **; p<0.01. (B) Micrographs (Top): H&E stained skin sections from Cox-2ΔM and littermate Cox-2fl/fl mice, either untreated or after 20 weeks of DMBA/TPA treatment. Graph (bottom): Epidermal thickness quantification. Twenty fields/mouse, four mice/genotype were counted for all fields. Error bars, SD. n.s., p>0.05. Scale bars: 50µm.
Figure 4
Figure 4. DMBA/TPA-induced skin proliferative responses and epidermal cell differentiation in Cox-2ΔE mice and Cox-2fl/fl littermate controls
(A) Untreated skin samples and skin samples from Cox-2fl/fl and Cox-2ΔE littermates taken 18 h after the last TPA treatment of the DMBA/TPA-tumor induction protocol, immunostained for Ki67. Arrows indicate Ki67-positive cells. Scale bars: 50µm. (B) Percentage of Ki67-positive basal cells in skin samples from untreated mice and DMBA/TPA-treated Cox-2ΔE and Cox-2fl/fl littermates (C) Untreated skin samples and skin samples from Cox-2fl/fl and Cox-2ΔE littermates taken 18 hours after the last TPA treatment, immunostained for K1. Arrows indicate K1-positive basal cells. Scale bars: 50µm. (D) Percentage of K1-positive basal cells in skin samples from untreated mice and DMBA/TPA-treated Cox-2ΔE and littermate Cox-2fl/fl mice. Ki67-positive and K1-positive basal cells were determined on at least 4 random areas for each section, 3 sections/mouse and 3 mice/genotype. Error bars, SD. *, p<0.05.
Figure 5
Figure 5. Proliferation and epithelial cell differentiation in DMBA/TPA-induced papillomas from Cox-2ΔE mice, Cox-2ΔM mice, and their Cox-2fl/fl littermates
DMBA/TPA-induced papillomas from at least four mice of each of the four groups were fixed, paraffin embedded, and immunostained for Ki67 and K1. (A) Micrographs (Left panels): Ki67-stained papilloma sections from Cox-2ΔE and littermate Cox-2fl/fl mice. Graphs (right panels): Percentage of Ki67-positive cells in papillomas from Cox-2ΔE mice and their Cox-2fl/fl littermates, and from Cox-2ΔM mice and their Cox-2fl/fl littermates. Each data point is the Ki67 value for one papilloma. (B) Micrographs (Left panels): K1-stained papilloma sections from Cox-2ΔE and littermate Cox-2fl/fl mice. Graphs (right panels): Percentage of K1-positive cells in papillomas from Cox-2ΔE mice and their Cox-2fl/fl littermates, and from Cox-2ΔM mice and their Cox-2fl/fl littermates. Each data point is the K1 value for one papilloma, ***, p<0.001. Scale bars: 100µm.
Figure 6
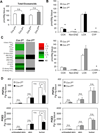
Figure 6. Eicosanoids of skin and tumors from mice with DMBA/TPA-induced skin tumors
(A) Total eicosanoids in tumors (n = 12) of DMBA/TPA-treated Cox-2ΔE mice, their Cox-2fl/fl littermates (n = 12), Cox-2ΔM mice (n = 14), and their Cox-2fl/fl littermates (n = 13). (B) Eicosanoids, separated by pathway of origin (COX-dependent, non-enzymatic, lipoxygenase-dependent and cytochrome P450 dependent), present in the tumor groups. Error bars, SD. *, p<0.05, determined by a two-tailed student’s t-test. (C) Heat maps depicting differences in COX-dependent eicosanoid amounts in Cox-2ΔE mice, Cox-2ΔM mice, and their respective Cox-2fl/fl littermates. For each eicosanoid, the amount in tumors from the Cox-2ΔE or Cox-2ΔM mice was divided by the amount in tumors from their control Cox-2fl/fl mice. Green indicates fold-decrease versus Cox-2fl/fl control tumors. Red indicates fold increases. Grey, no significant change compared to control Cox-2fl/fl tumors. Black (ND), the eicosanoid was either not detected or below the detectable limit. Only eicosanoids significantly different (p<0.05) from control littermates are shown. (D) PGF and PGE2 amounts detected in untreated skin, in skin from mice treated with DMBA/TPA, and in papillomas from Cox-2ΔE mice, Cox-2ΔM mice, and their cohort littermate Cox-2fl/fl control mice (untreated skin from all mice, DMBA/TPA-treated skin of Cox-2ΔM mice and DMBA/TPA-treated skin of control Cox-2fl/fl mice, n=6; DMBA/TPA-treated skin of Cox-2ΔE mice, n=8; DMBA/TPA-treated-skin of control Cox-2fl/fl mice, n=7). For papillomas, numbers of samples are the same as panels 6A–6C. Error bars, SD. **, p<0.005, determined by a two-tailed Student’s t-test.
Figure 7
Figure 7. Macrophage infiltration and blood vessel density in DMBA/TPA-induced papillomas from Cox-2ΔE mice, Cox-2ΔM mice, and their Cox-2fl/fl littermates
DMBA/TPA-induced papillomas from mice of the four groups were fixed, paraffin embedded, and immunostained for F4/80 and for CD31. (A) Micrographs (Left panels): F4/80-stained papilloma sections from Cox-2ΔE mice, Cox-2ΔM mice, and their respective Cox-2fl/fl littermates. Graphs (right panels): Number of F4/80-positive cells/papilloma tumor area for Cox-2ΔE mice and their Cox-2fl/fl littermates, and for Cox-2ΔM mice and their Cox-2fl/fl littermates. Each data point is the F4/80 value for one papilloma. (B) Micrographs (Left panels): CD31-stained papilloma sections from Cox-2ΔE mice, Cox-2ΔM mice, and their respective Cox-2fl/fl littermates. Graphs (right panels): Vessel density in papillomas from Cox-2ΔE mice and their Cox-2fl/fl littermates, and from Cox-2ΔM mice and their Cox-2fl/fl littermates. Each data point is the vessel density value for one papilloma. **, p<0.01. n.s, p>0.05. Scale bars: 100µm.

References

    1. Donaldson MR, Coldiron BM. No end in sight: the skin cancer epidemic continues. Semin Cutan Med Surg. 2011;30:3–5. - PubMed
    1. Schwarz M, Munzel PA, Braeuning A. Non-melanoma skin cancer in mouse and man. Arch Toxicol. 2013;87:783–798. - PubMed
    1. Kemp CJ. Multistep skin cancer in mice as a model to study the evolution of cancer cells. Seminars in cancer biology. 2005;15:460–473. - PubMed
    1. Balmain A, Brown K. Oncogene activation in chemical carcinogenesis. Adv Cancer Res. 1988;51:147–182. - PubMed
    1. Abel EL, Angel JM, Kiguchi K, DiGiovanni J. Multi-stage chemical carcinogenesis in mouse skin: fundamentals and applications. Nat Protoc. 2009;4:1350–1362. - PMC - PubMed

Publication types

MeSH terms