

Aberrant methylation of tRNAs links cellular stress to neuro-developmental disorders
- PMID: 25063673
- PMCID: PMC4195770
- DOI: 10.15252/embj.201489282
Aberrant methylation of tRNAs links cellular stress to neuro-developmental disorders
Abstract
Mutations in the cytosine-5 RNA methyltransferase NSun2 cause microcephaly and other neurological abnormalities in mice and human. How post-transcriptional methylation contributes to the human disease is currently unknown. By comparing gene expression data with global cytosine-5 RNA methylomes in patient fibroblasts and NSun2-deficient mice, we find that loss of cytosine-5 RNA methylation increases the angiogenin-mediated endonucleolytic cleavage of transfer RNAs (tRNA) leading to an accumulation of 5' tRNA-derived small RNA fragments. Accumulation of 5' tRNA fragments in the absence of NSun2 reduces protein translation rates and activates stress pathways leading to reduced cell size and increased apoptosis of cortical, hippocampal and striatal neurons. Mechanistically, we demonstrate that angiogenin binds with higher affinity to tRNAs lacking site-specific NSun2-mediated methylation and that the presence of 5' tRNA fragments is sufficient and required to trigger cellular stress responses. Furthermore, the enhanced sensitivity of NSun2-deficient brains to oxidative stress can be rescued through inhibition of angiogenin during embryogenesis. In conclusion, failure in NSun2-mediated tRNA methylation contributes to human diseases via stress-induced RNA cleavage.
Keywords: 5‐methylcytidine; Misu; NSun2; RNA modification.
© 2014 The Authors. Published under the terms of the CC BY 4.0 license.
Figures
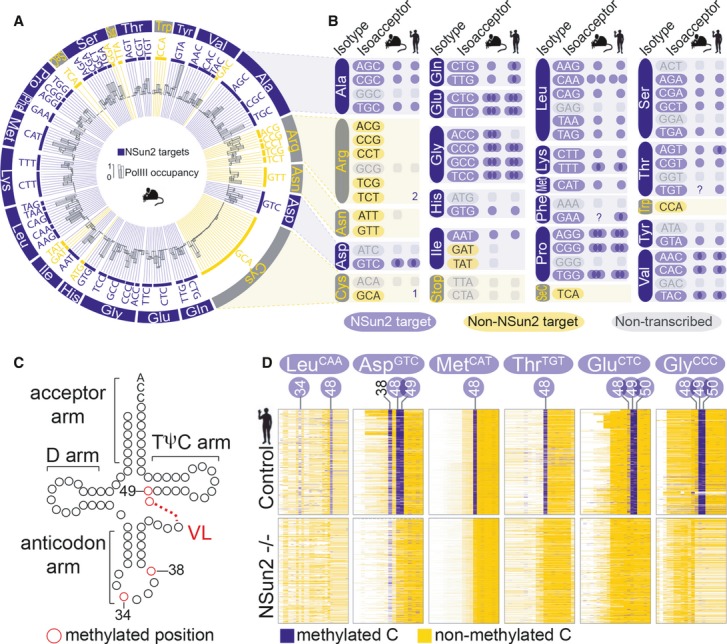
Circular plot of NSun2-targeted (blue bars) and not targeted or not expressed (yellow bars) tRNA genes discovered by RNA-seq and Pol III ChIP-seq in mouse skin. The outer ring shows tRNA isotypes, followed by isoacceptors (inner ring) and Pol III binding (black bars).
Schematic summary of NSun2-methylated (blue) and not methylated (yellow) tRNA isoacceptors in mouse and human. Blue circles indicate the number of methylated cytosines by NSun2. Non-transcribed tRNA isoacceptors are marked in grey. 1,2: total number of methylated tRNA genes in that particular isoacceptor. ?: missing reads.
tRNA secondary structure showing the acceptor arm, the D arm, the anticodon arm, the variable loop (VL) and the TΨC arm. The number of nucleosides in the variable loop (VL) vary (red dotted line). The position of known m5C-methylated cytosines in the anticodon loop (C34, 38) and the VL junction (C48, 49) is marked in red.
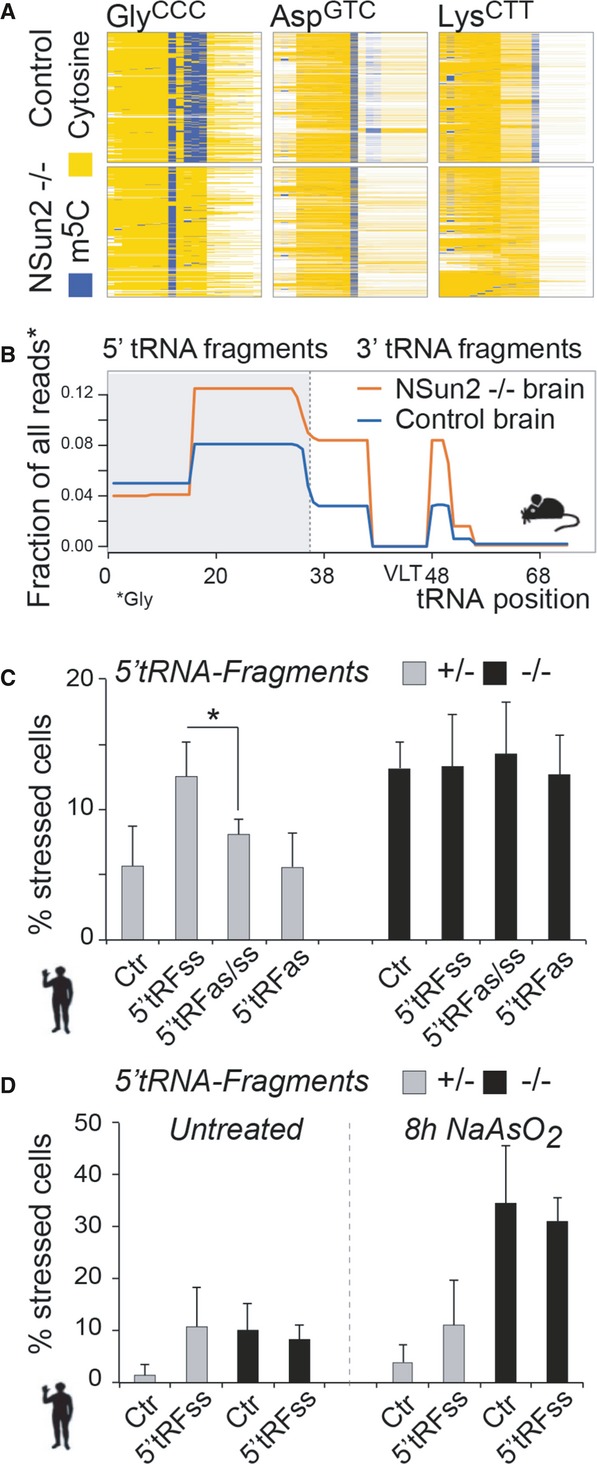
Bisulphite-converted RNA to detect m5C in tRNAs in patient cells expressing (control) or lacking NSun2 (−/−). Shown are the sequence reads (rows) of methylated (blue) and unmethylated (yellow) cytosines (columns) in the indicated tRNAs. The positional number of each methylated cytosine is shown at the top. Blue circles mark NSun2-dependent methylation. C38 is methylated by Dnmt2.
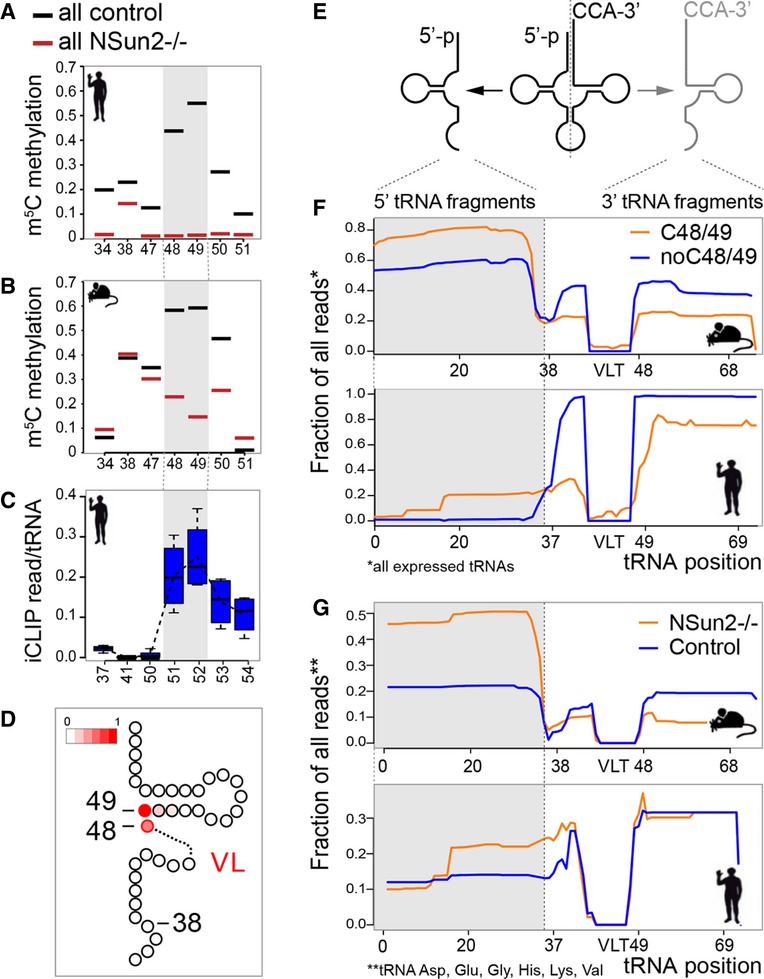
A, B Frequency of m5C in all tRNAs in NSun2-expressing (control) and NSun2-lacking (−/−) human (A) and mouse (B) tRNAs. Grey boxes indicate cytosines 48 and 49.
C Detection of NSun2-binding to cytosines in tRNAs using miCLIP method. Grey box indicates cytosines 48 and 49.
D Scheme of 3′ half of a tRNA cloverleaf structure showing frequency of methylation at C48, 49 (red).
E Scheme of cleaved tRNA through the anticodon loop.
F Average fraction of 5′ (grey box) and 3′/CCA-tagged tRNA fragments using all expressed tRNAs with (orange line) and without (blue line) a cytosine at positions 48 and 49 in NSun2-expressing mouse (upper panel) and human (lower panel) samples.
G Isotype-specific enrichment of 5′ tRNA fragments (grey box) in NSun2−/− (orange line) versus respective control (blue line) in mouse (upper panel) and human (lower panel) samples.
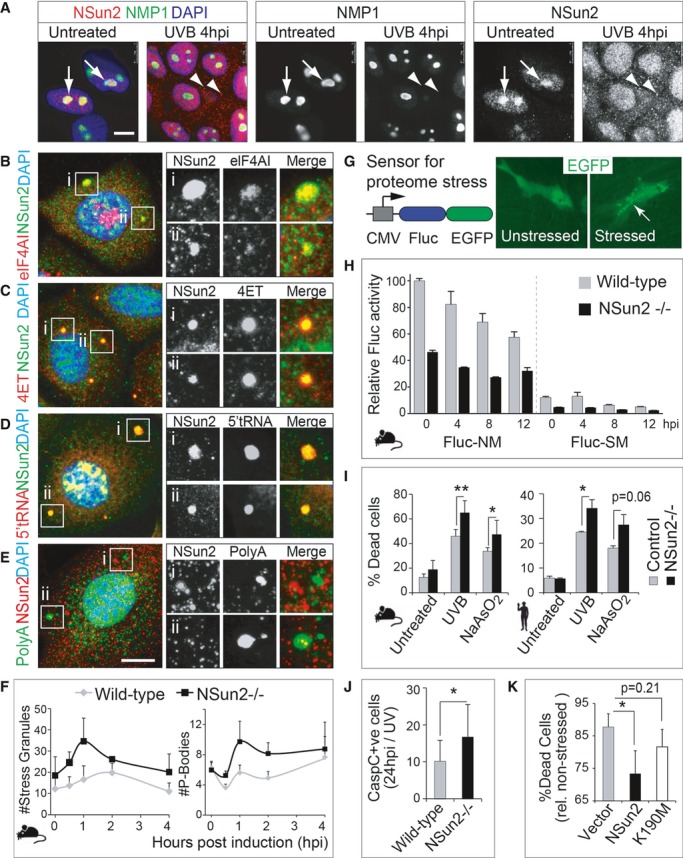
A Immunofluorescence for NSun2 (red) and NMP1 (green) in untreated (left hand panels) and UV-radiated (right hand panels) human primary keratinocytes. Arrows indicate nucleoli, and arrowheads point to NSun2-positive cytoplasmic granules.
B–E Co-localisation of NSun2 (green: B–D; red: E) with markers for SGs (eIFAI; red) (B), PBs (4ET; red) (C), 5′ tRNA halves (red) (D) or polyA RNA (green)-containing granules (E) in mouse primary keratinocytes after 4 h of exposure to UV. (i) and (ii) are magnified cytoplasmic granules for the respective stainings.
F Automated counting of number of SGs (left hand panel) and PBs (right hand panel) per mouse cell after exposure to UV for the indicated hours. Error bars: SEM (n = 3 experiments; 1 experiment: all cells in 30 optical fields).
G Schematic view of the proteome stress sensor Fluc-GFP construct (left hand panel) and cytoplasmic localisation of GFP-tagged Fluc construct (green) changes to protein aggregates after stress (right hand panel).
H Luminescence activity of Fluc-NM (not mutated) and Fluc-SM (single mutation) stress reporters in wild-type and NSun2−/− mouse keratinocytes upon UV exposure. Fluc luminescence is normalised to Renilla activity. Error bars, SD (n = 3).
I Percentage of dead mouse (left hand panel) and human (right hand panel) primary cells in culture expressing (Control) or lacking NSun2 (−/−) 24 h after UV radiation and exposure to NaAsO2.
J Quantification of cleaved caspase-3-positive cells in back skin of wild-type (WT) and NSun2 knockout (−/−) mice after 24 h of UV radiation.
K Percentage of dead cells overexpressing an empty vector control (Vector), NSun2 or mutated NSun2 K190M after 24 h of UV treatment.
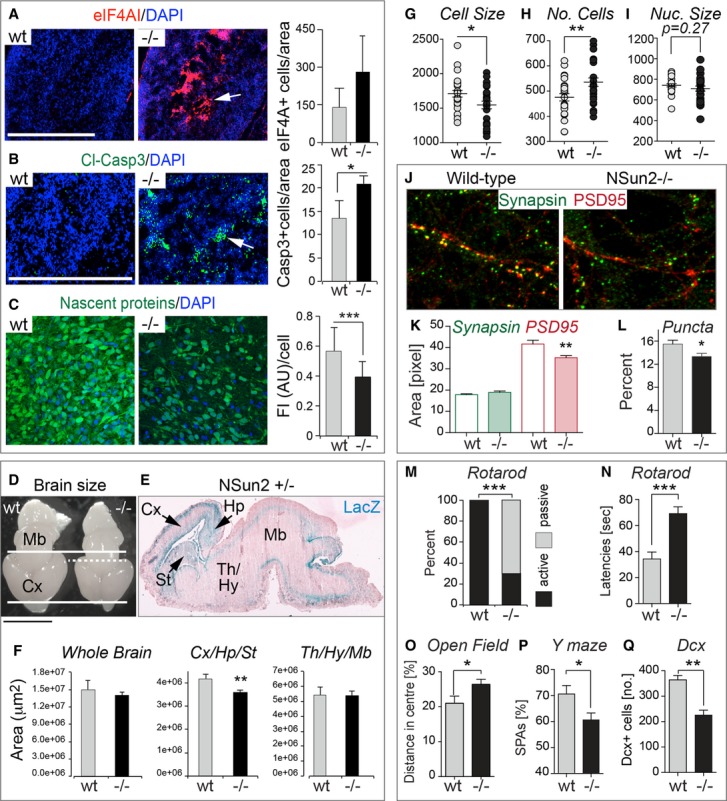
A, B Immunofluorescence staining for stress granules (eIF4AI, red) (A) and apoptosis (cleaved caspase-3, green) (B) in brain sagittal sections of E18.5 embryos. Arrows indicate brain areas stained with the indicated marker. Automated counting of number of stressed cells (eIF4AI+ cells) (A) or apoptotic cells (cleaved caspase-3+ cells) (B) per million μm2 in the whole brain is shown on the right. Error bars: SD (n ≥ 3). Nuclei are counterstained with DAPI (blue).
C Fluorescence labelling of nascent proteins (green) in cultured brain slices of E18.5 embryos incubated with OP-puromycin. Quantification of fluorescence intensity per cell is shown on the right. FI (AU): fluorescence intensity (arbitrary units). Error bars: SD (n ≥ 3 mice; 1 mouse: all cells in 10 optical fields). Nuclei are counterstained with DAPI (blue).
D Brains of NSun2−/− (−/−) and control (wt) E18.5 embryos. Thick lines delimit the rostrocaudal extent of the wt cerebral cortex (Cx). Dash line delimits the cortex of NSun2−/− brain.
E LacZ staining (blue) of a brain sagittal section of NSun2+/− E18.5 embryo. Blue indicates NSun2 expression. Pink is eosin counterstaining. Arrows indicate highest NSun2 expression.
F Areas of the whole brain, cortex, hippocampus and striatum (Cx/Hp/St), and thalamus, hypothalamus and midbrain (Th/Hy/Mb) measured from sagittal sections. Error bars: SD (n ≥ 3).
G–I Automated counting of cell size in pixels (G) and number of cells (H) of cortical neurons in NSun2−/− (−/−) and control (wt) E18.5 embryos and nuclear size (I) measured as number of cells analysed per optical field. Error bars: SD (n ≥ 3 mice; 1 mouse: all cells in seven optical fields).
J–L Analysis of synaptic puncta formation in cultured cortical neurons from NSun2−/− (−/−) and wild-type (NSun2+/+, wt) E17.5 embryos. (J) Immunofluorescence of pre- (green) and post-synaptic puncta (red). (K) Automated area analysis of pre- (green) and post-synaptic puncta (red). (L) Percentage of functional synapses. Error bars: SD (n ≥ 3 mice; 1 mouse: all cells in seven optical fields).
M–Q Behavioural differences in NSun2 −/− versus wild-type (wt) adult mice. (M) Latency to fall (active) or to stay (passive) on the rotarod. Shown is the percentage of animals with at least one passive rotation. Wt: n = 13; −/−: n = 26.
N Mean latencies of three trials to fall on the rotarod (genotype P = 0.09, body mass P = 0.55; trial number P < 0.0001; linear mixed effects model). Wt: n = 13; −/−: n = 26.
O Percentage of the distance travelled in the centre of the open field. Wt: n = 20; (−/−): n = 20. Error bar: SEM.
P Percentage spontaneous alternations (% SPAs) in the Y maze using male wt and −/− mice (wt: n = 6; −/−: n = 10). Error bar: SEM.
Q Number of doublecortin (DCX)+ cells in the hippocampal dentate gyrus in adult male mice. Error bar: SEM.
Bisulphite-converted RNA to detect m5C (blue columns) in tRNAs in the frontal lobe of brains from E18.5 embryos expressing (control) or lacking NSun2 (−/−).
Isotype-specific enrichment of 5′ tRNA fragments (grey box) in NSun2−/− (orange line) versus respective control (blue line) in E18.5 embryonic brains.
Percentage of NSun2+/− and NSun2−/− stressed (with aggregated GFP) human fibroblasts in response to synthetic sense 5′ tRNA fragments (5′ tRFss) or sense and antisense 5′ tRNA fragments (ss, as).
Stress response of untreated (left hand panel) and treated with NaAsO2 (right hand panel) NSun2+/− and NSun2−/− human fibroblasts to 5′ tRNA fragments.
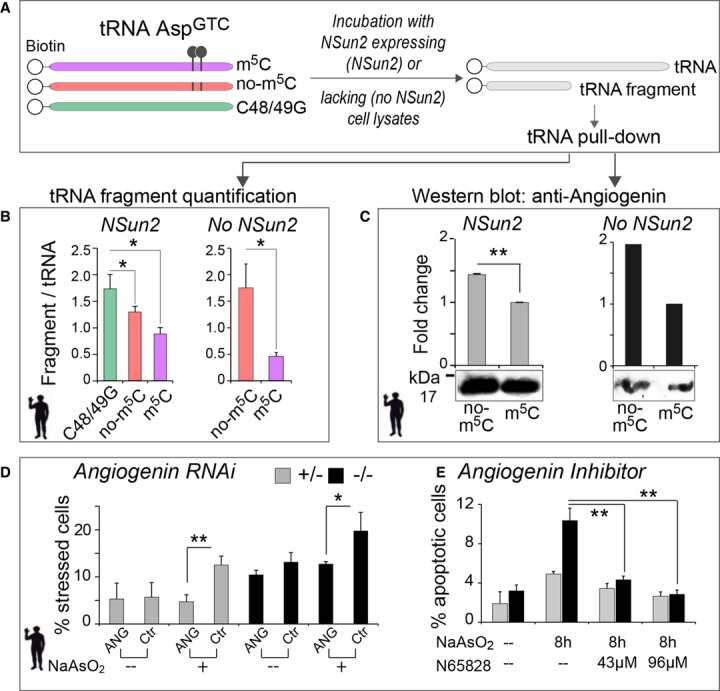
A Schematic illustration of in vitro synthesised 5′ biotinylated tRNA AspGTC constructs (left hand panel) with (purple) or without m5C (red) at position 48 and 49, and a construct with substituted cytosines to guanosines (C48/49G; green). Synthetic tRNA constructs are incubated with NSun2 expressing (NSun2+/−, NSun2) or lacking (NSun2−/−, no NSun2) cell lysates to measure tRNA fragmentation and angiogenin binding.
B Quantification of tRNA fragments pooled after incubation with cell lysates. Error bars: SD (n = 3).
C Western blot (lower panel) and quantification (upper panel) of angiogenin bound to the indicated tRNA constructs after incubation with cell lysates. Pooled full-length tRNA was used for normalisation. Error bars: SD (n = 3).
D, E Percentage of NSun2+/− and NSun2−/− stressed (D) or apoptotic (E) cells when angiogenin is inhibited by RNAi (D) or the small-molecule inhibitor N65828 (E). Cells are either treated for 8 h with NaAsO2 or untreated (–) as indicated.
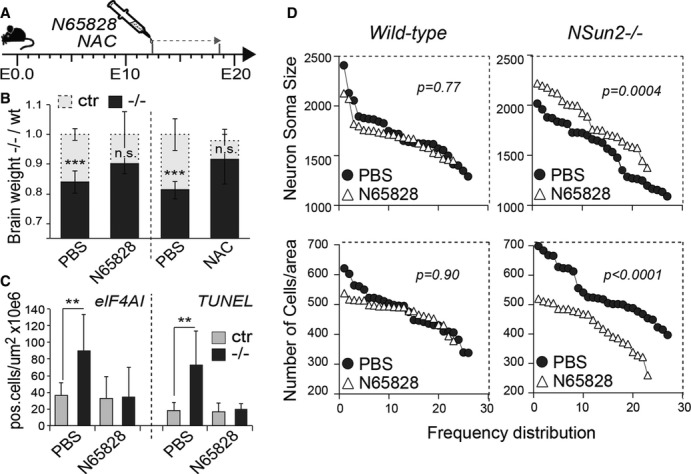
A Injection schedule of pregnant mouse females with N65828 (angiogenin inhibitor) and NAC along embryonic development.
B–D Rescue of neuro-developmental defects in NSun2−/− mice in vivo. (B) Brain weight fold change of NSun2−/− (−/−, black bars) versus wild-type (wt, grey bars) embryos after N65828 and NAC treatment as indicated in (A). Control embryos were treated with PBS. (C) Number of stressed cells (eIF4AI+ cells) (left hand panel) or apoptotic cells (TUNEL+ cells) (right hand panel) per million μm2 in the frontal brain lobe of wild-type (Ctr) and NSun2−/− (−/−) embryos after treatment. (D) Frequency distribution of size (pixels) (top panels) and number of cell counts per area (bottom panels) of cortical neurons from wild-type and NSun2−/− E18.5 embryos after treatment. Error bars: SD (n ≥ 3). *P < 0.1, **P < 0.05. and ***P < 0.001 (B, C).
Comment in
-
tRNAs: new tricks from old dogs.EMBO J. 2014 Sep 17;33(18):1981-3. doi: 10.15252/embj.201489634. Epub 2014 Sep 12. EMBO J. 2014. PMID: 25216676 Free PMC article.
References
-
- Abbasi-Moheb L, Mertel S, Gonsior M, Nouri-Vahid L, Kahrizi K, Cirak S, Wieczorek D, Motazacker MM, Esmaeeli-Nieh S, Cremer K, Weissmann R, Tzschach A, Garshasbi M, Abedini SS, Najmabadi H, Ropers HH, Sigrist SJ, Kuss AW. Mutations in NSUN2 cause autosomal-recessive intellectual disability. Am J Hum Genet. 2012;90:847–855. - PMC - PubMed
-
- Alexandrov A, Chernyakov I, Gu W, Hiley SL, Hughes TR, Grayhack EJ, Phizicky EM. Rapid tRNA decay can result from lack of nonessential modifications. Mol Cell. 2006;21:87–96. - PubMed
-
- Anderson P, Kedersha N. Stress granules: the Tao of RNA triage. Trends Biochem Sci. 2008;33:141–150. - PubMed
Publication types
MeSH terms
Substances
Associated data
- Actions
Grants and funding
LinkOut - more resources
Full Text Sources
Other Literature Sources
Medical
Molecular Biology Databases
Miscellaneous
