Nocturnal oxygen saturation profiles of healthy term infants
- PMID: 25063836
- PMCID: PMC4283696
- DOI: 10.1136/archdischild-2013-305708
Nocturnal oxygen saturation profiles of healthy term infants
Abstract
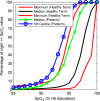
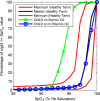
Objective: Pulse oximetry is used extensively in hospital and home settings to measure arterial oxygen saturation (SpO2). Interpretation of the trend and range of SpO2 values observed in infants is currently limited by a lack of reference ranges using current devices, and may be augmented by development of cumulative frequency (CF) reference-curves. This study aims to provide reference oxygen saturation values from a prospective longitudinal cohort of healthy infants.
Design: Prospective longitudinal cohort study.
Setting: Sleep-laboratory.
Patients: 34 healthy term infants were enrolled, and studied at 2 weeks, 3, 6, 12 and 24 months of age (N=30, 25, 27, 26, 20, respectively).
Interventions: Full overnight polysomnography, including 2 s averaging pulse oximetry (Masimo Radical).
Main outcome measurements: Summary SpO2 statistics (mean, median, 5th and 10th percentiles) and SpO2 CF plots were calculated for each recording. CF reference-curves were then generated for each study age. Analyses were repeated with sleep-state stratifications and inclusion of manual artefact removal.
Results: Median nocturnal SpO2 values ranged between 98% and 99% over the first 2 years of life and the CF reference-curves shift right by 1% between 2 weeks and 3 months. CF reference-curves did not change with manual artefact removal during sleep and did not vary between rapid eye movement (REM) and non-REM sleep. Manual artefact removal did significantly change summary statistics and CF reference-curves during wake.
Conclusions: SpO2 CF curves provide an intuitive visual tool for evaluating whether an individual's nocturnal SpO2 distribution falls within the range of healthy age-matched infants, thereby complementing summary statistics in the interpretation of extended oximetry recordings in infants.
Keywords: Measurement; Respiratory; Sleep; Technology.
Published by the BMJ Publishing Group Limited. For permission to use (where not already granted under a licence) please go to http://group.bmj.com/group/rights-licensing/permissions.
Figures


References
-
- Horemuzova E, Katz-Salamon M, Milerad J. Breathing patterns, oxygen and carbondioxide levels in sleeping healthy infants during the first nine months after birth. Acta Paediatr 2000;89:1284–9. - PubMed
-
- Hunt CE, Corwin MJ, Lister G, et al. Longitudinal assessment of hemoglobin oxygen saturation in healthy infants during the first 6 months of age. J Pediatr 1999;135:580–6. - PubMed
-
- Poets CF, Stebbens VA, Alexander JR, et al. Arterial oxygen saturation in preterm infants at discharge from hospital and six weeks later. J Pediatr 1992;120:447–54. - PubMed
-
- Poets CF, Stebbens VA, Lang JA, et al. Arterial oxygen saturation in healthy term neonates. Eur J Pediatr 1996;155:219–23. - PubMed
-
- Poets CF, Stebbens VA, Southall DP. Arterial oxygen saturation and breathing movements during the first year of life. J Dev Physiol 1991;15:341–5. - PubMed
Publication types
MeSH terms
Substances
LinkOut - more resources
Full Text Sources
Other Literature Sources
