. 2014 Nov;96(5):907-15.
doi: 10.1189/jlb.3A0314-152R. Epub 2014 Jul 25.

Phosphodiesterase 2A is a major negative regulator of iNOS expression in lipopolysaccharide-treated mouse alveolar macrophages

Affiliations

Phosphodiesterase 2A is a major negative regulator of iNOS expression in lipopolysaccharide-treated mouse alveolar macrophages

Otgonchimeg Rentsendorj et al. J Leukoc Biol. 2014 Nov.

Abstract

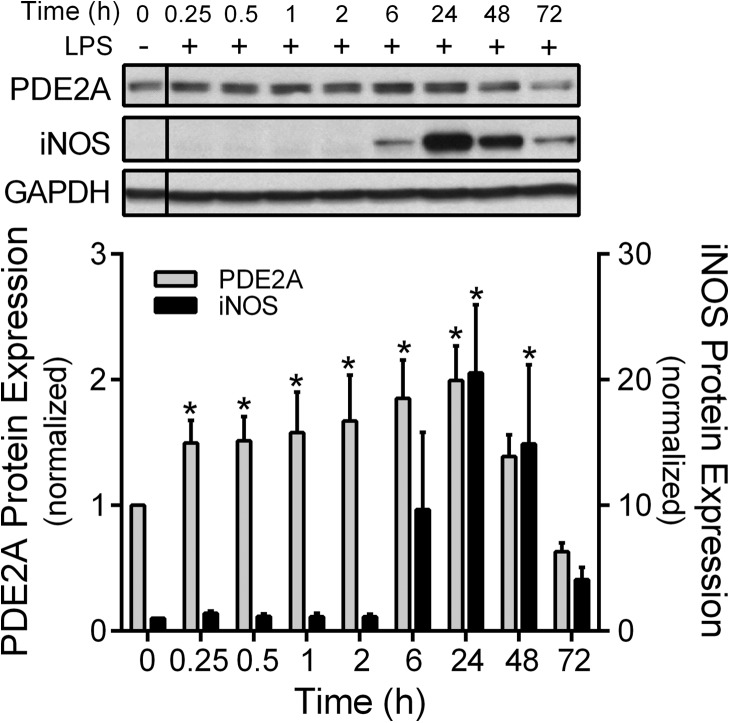
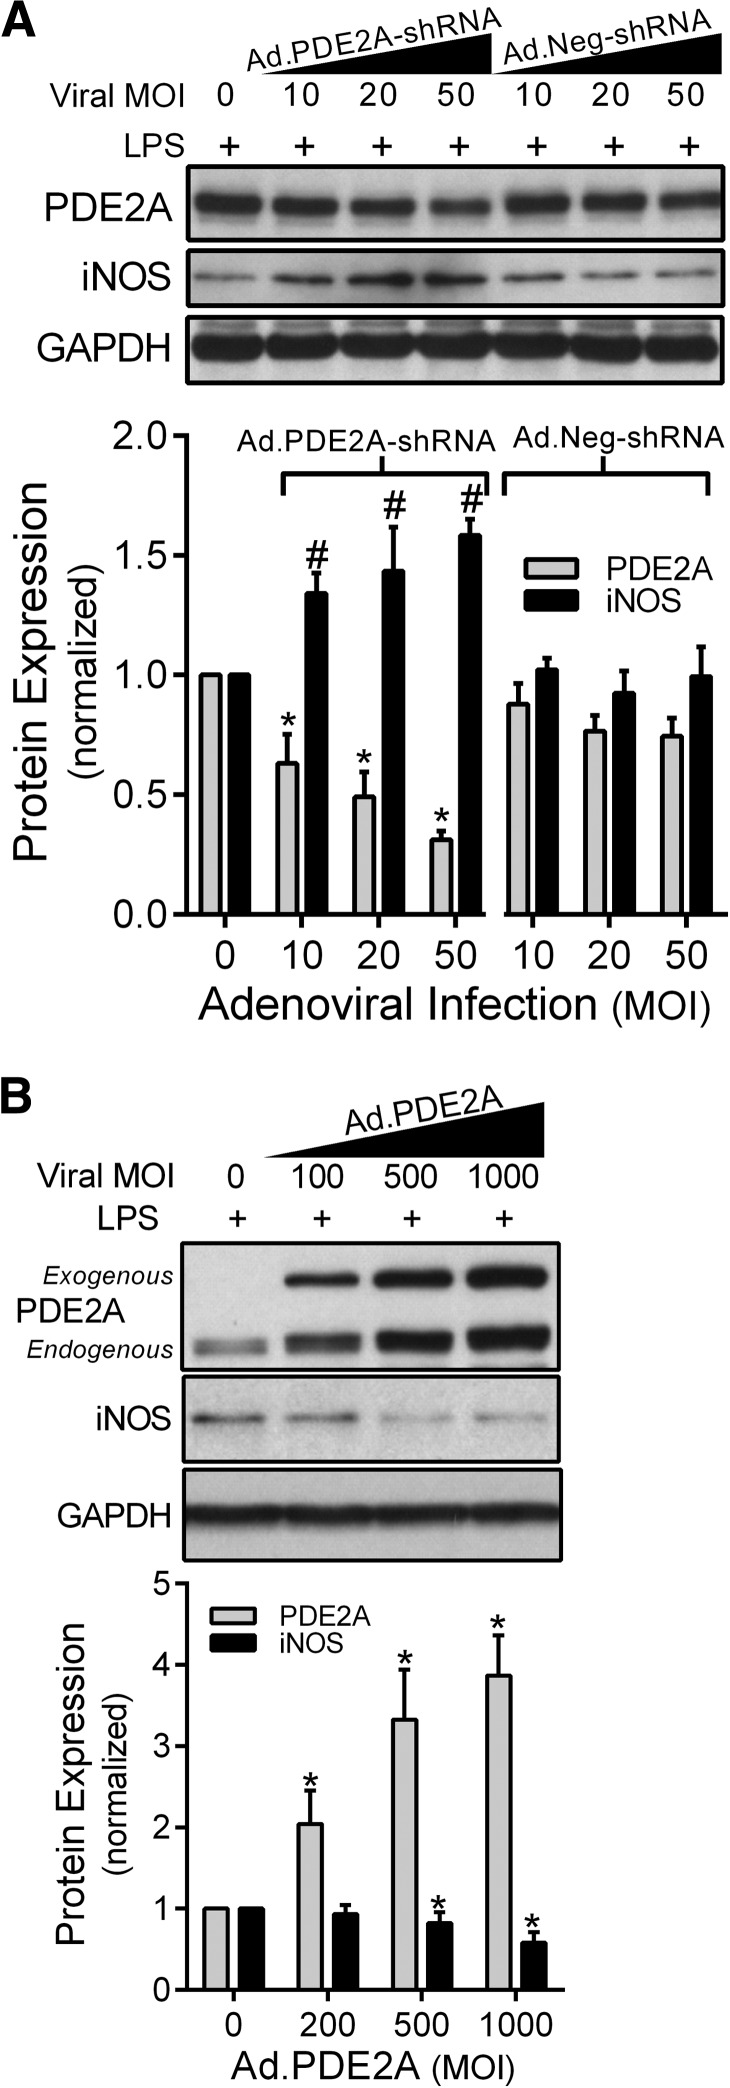
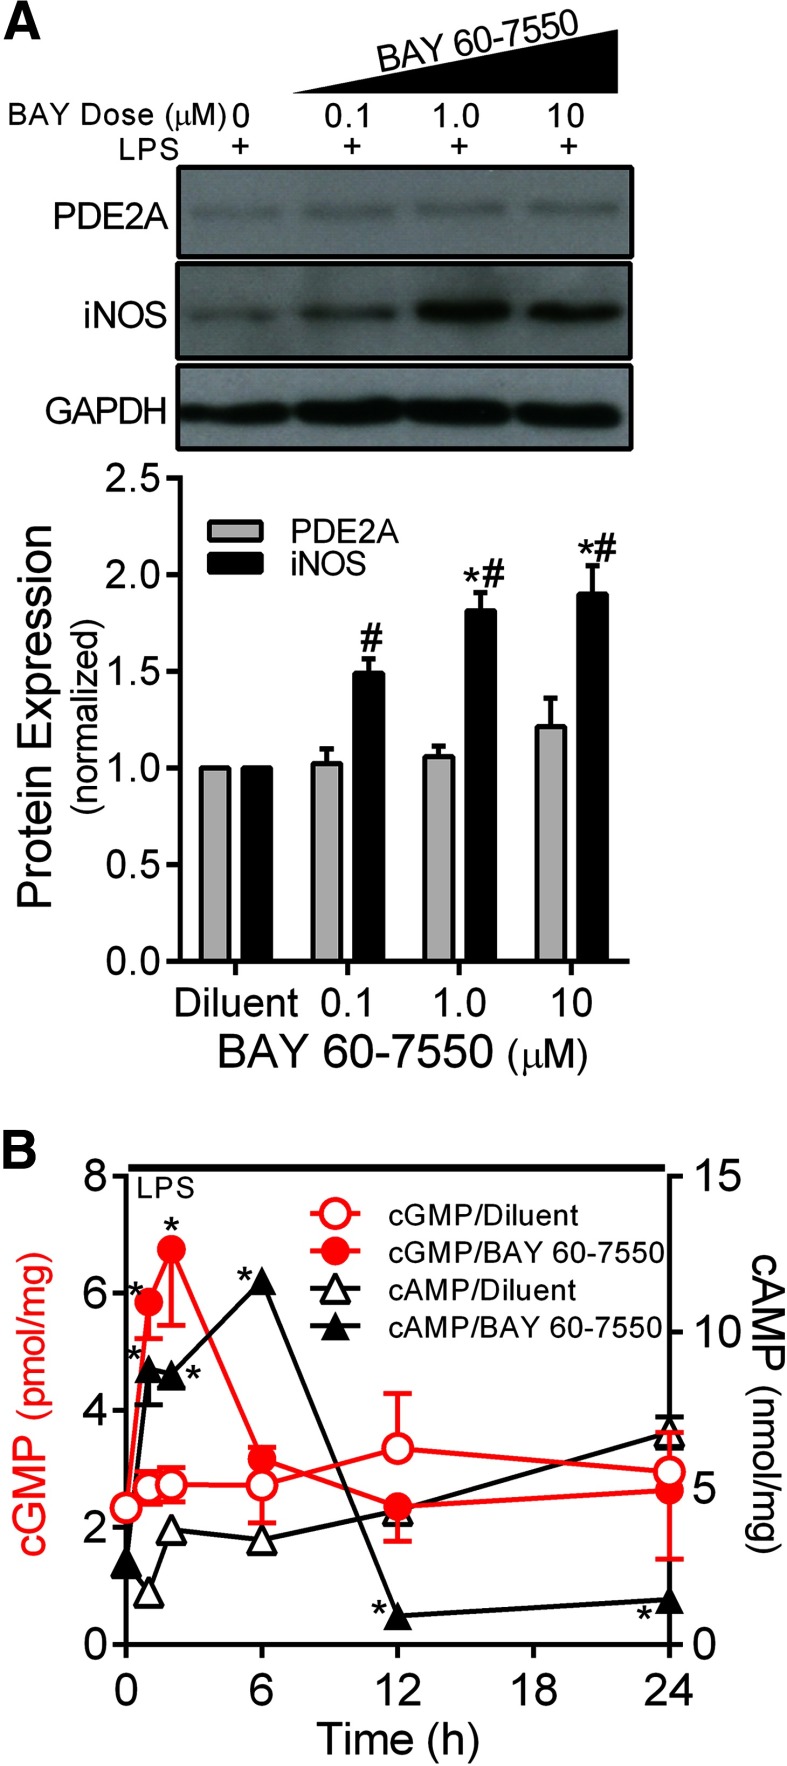
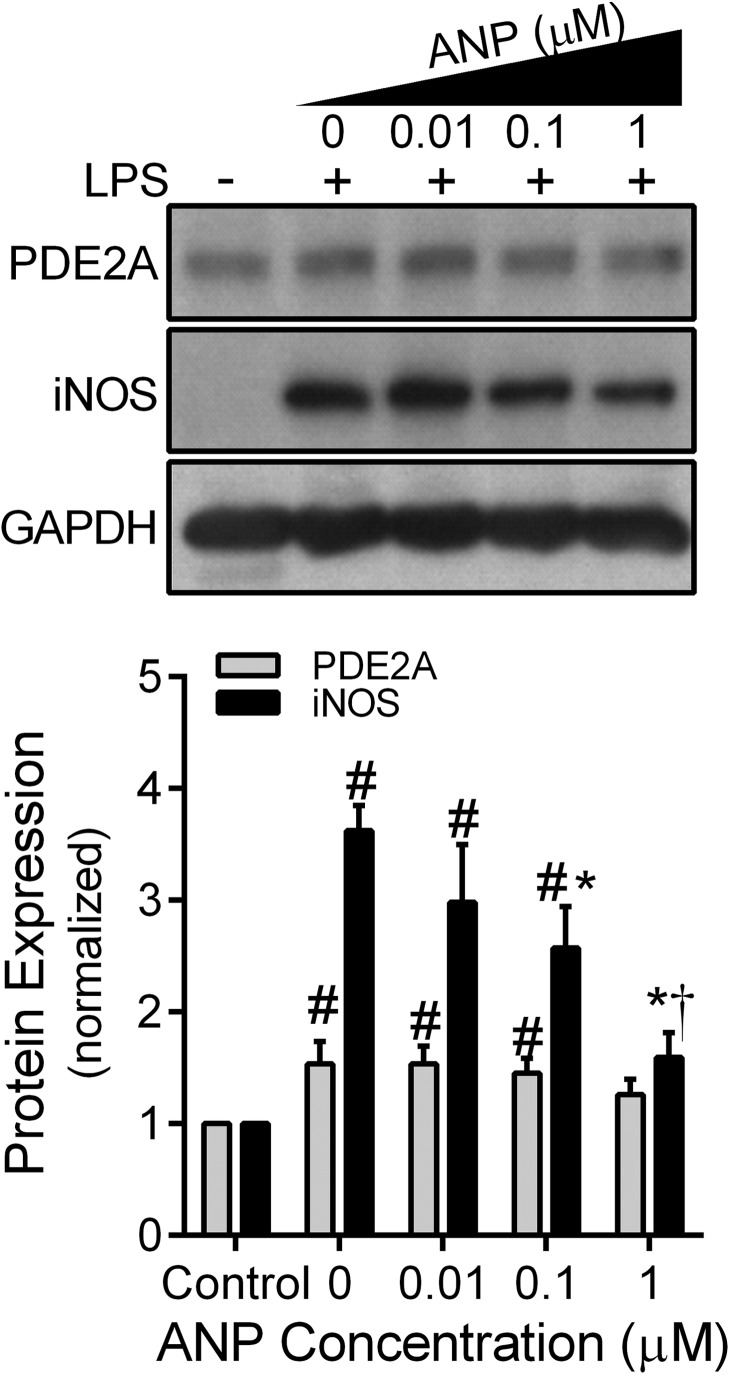
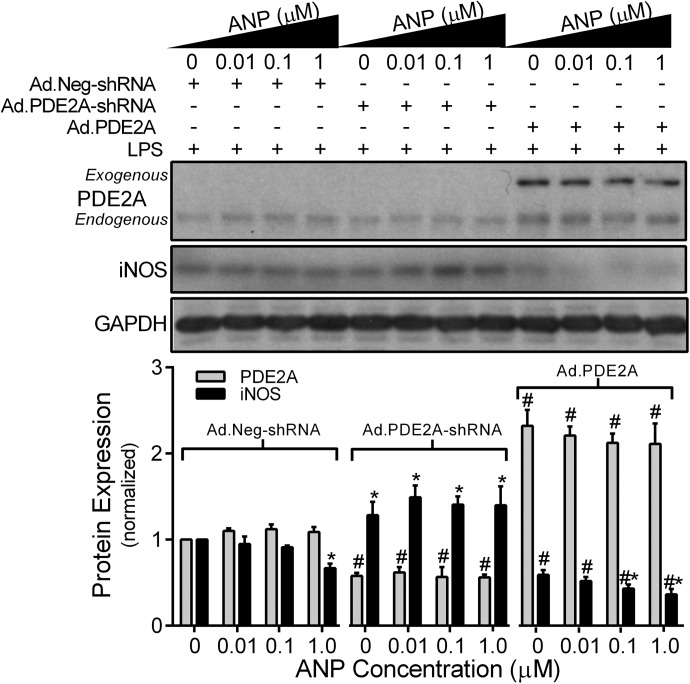
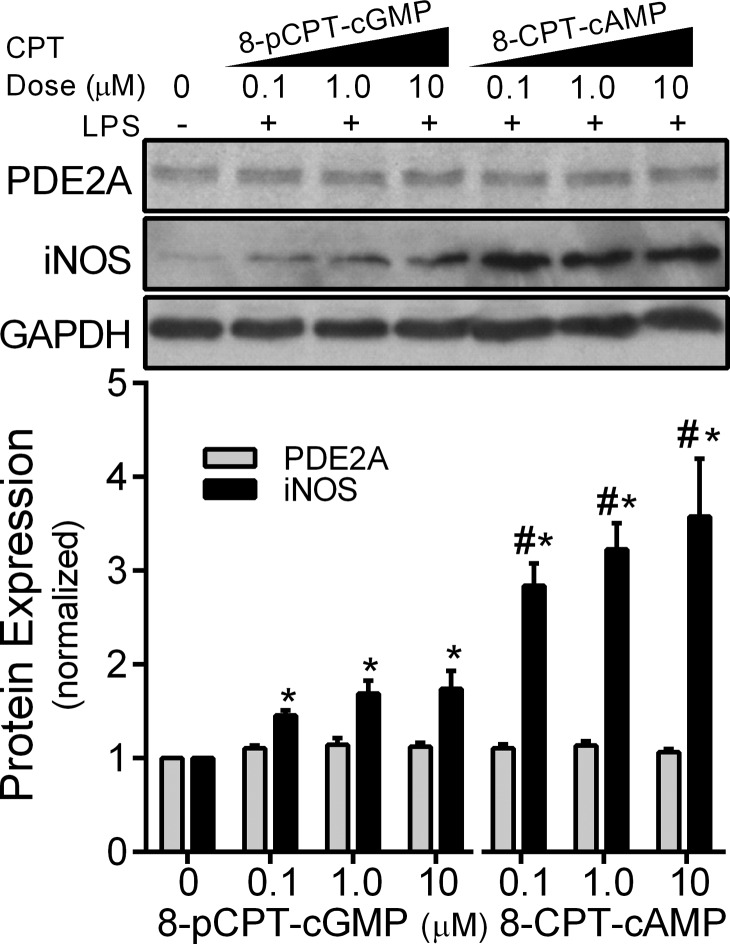
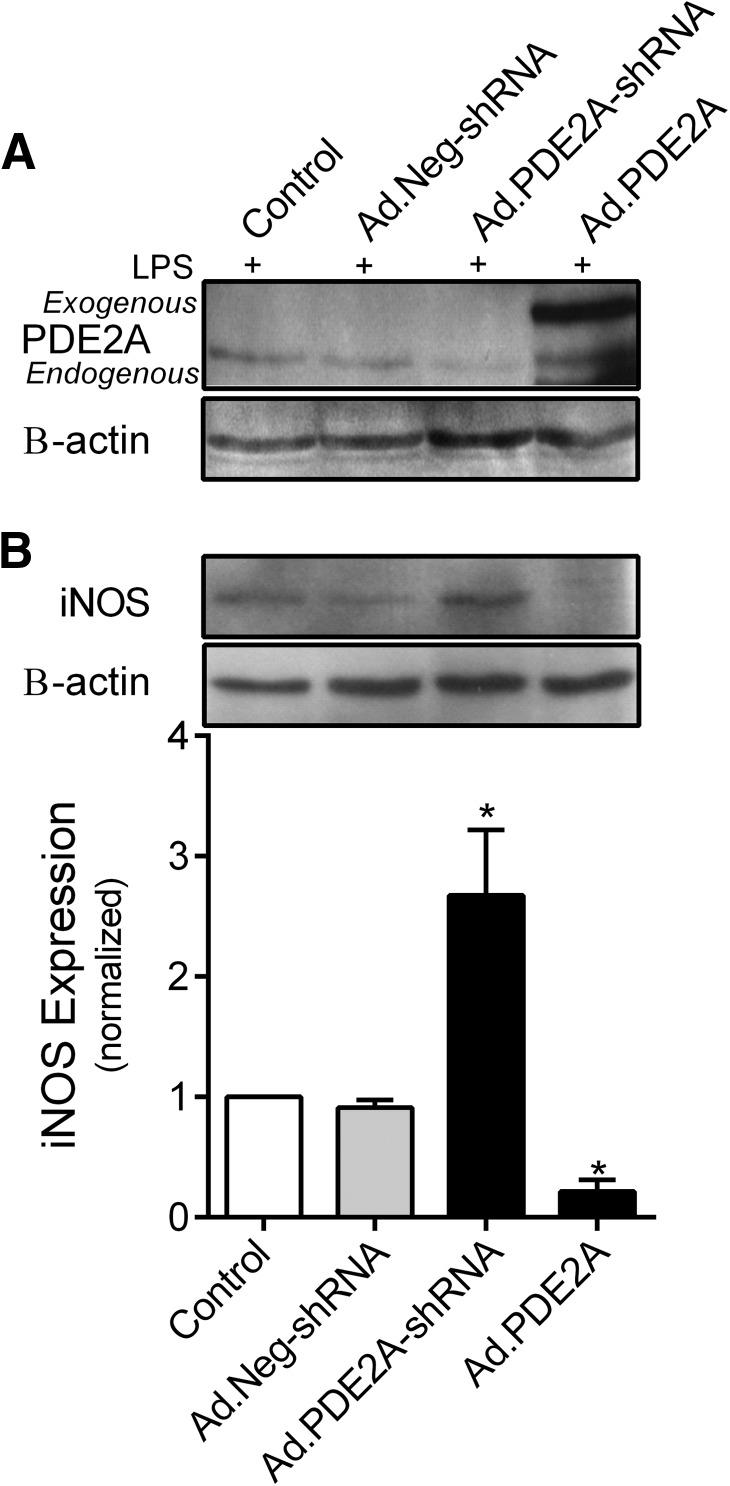
PDE2A is a dual-function PDE that is stimulated by cGMP to hydrolyze cAMP preferentially. In a two-hit model of ALI, we found previously that PDE2A decreased lung cAMP, up-regulated lung iNOS, and exacerbated ALI. Recent data suggest that macrophage iNOS expression contributes to ALI but later, promotes lung-injury resolution. However, macrophage iNOS is increased by cAMP, suggesting that PDE2A could negatively regulate macrophage iNOS expression. To test this, we examined the effects of manipulating PDE2A expression and function on LPS-induced iNOS expression in a mouse AM cell line (MH-S) and primary mouse AMs. In MH-S cells, LPS (100 ng/ml) increased PDE2A expression by 15% at 15 min and 50% at 6 h before decreasing at 24 h and 48 h. iNOS expression appeared at 6 h and remained increased 48 h post-LPS. Compared with control Ad, Ad.PDE2A-shRNA enhanced LPS-induced iNOS expression further by fourfold, an effect mimicked by the PDE2A inhibitor BAY 60-7550. Adenoviral PDE2A overexpression or treatment with ANP decreased LPS-induced iNOS expression. ANP-induced inhibition of iNOS was lost by knocking down PDE2A and was not mimicked by 8-pCPT-cGMP, a cGMP analog that does not stimulate PDE2A activity. Finally, we found that in primary AMs from LPS-treated mice, PDE2A knockdown also increased iNOS expression, consistent with the MH-S cell data. We conclude that increased AM PDE2A is an important negative regulator of macrophage iNOS expression.

Keywords: acute lung injury; atrial natriuretic peptide; cyclic nucleotide; nitric oxide; pneumonia.


Figures

Figure 1.
Figure 1.. Time course of PDE2A and iNOS protein expression by Western immunoblot in MH-S macrophages following LPS (100 ng/ml).
The PDE2A and iNOS protein levels are normalized to GAPDH loading control and then to control MH-S cells not exposed to LPS (n=3 independent experiments). The vertical line separating the control LPS cells indicates that this lane came from a different part of the same gel. Values are means ± se. *P < 0.05 versus the Time 0 control cells.
Figure 2.
Figure 2.. PDE2A and iNOS protein expression by Western immunoblot in MH-S macrophages that were first infected with increasing Ad MOI to manipulate PDE2A expression, followed 48 h later by LPS (100 ng/ml) exposure for an additional 8 h.
(A) The effect of Ad.PDE2A-shRNA versus the control Ad.Neg-shRNA. (B) The effect of PDE2A overexpression with Ad.PDE2A. PDE2A has two bands, as the exogenous PDE2A is coupled with GFP. The PDE2A and iNOS protein levels are normalized to GAPDH loading control and then to control MH-S cells exposed to LPS but not Ad (n=3 independent experiments). Values are means ± se. #P = 0.05 versus Ad.Neg-shRNA by ANOVA interaction; *P < 0.03 versus Ad.Neg-shRNA by ANOVA interaction.
Figure 3.
Figure 3.. (A) Effect of increasing concentrations of the PDE2A inhibitor BAY 65–7550 on MH-S macrophage PDE2A and iNOS expression by Western blot with densitometric analysis measured after 24 h of exposure to LPS (100 ng/ml).
The PDE2A and iNOS protein levels are normalized to GAPDH loading control and then to control cells that were exposed to LPS with BAY 65–7550 diluent (n=3 independent experiments). Values are means ± se. #P < 0.001 versus diluent; *P < 0.001 versus 0.1 μM BAY 60–7550. (B) Effect of BAY 65–7550 (1 μM) versus the DMSO diluent on the time course of intracellular cGMP (red) and cAMP (black) concentrations in MH-S macrophages exposed to LPS (100 ng/ml; n=3–6 independent experiments). Values are means ± se. *P < 0.002 versus diluent by ANOVA interaction.
Figure 4.
Figure 4.. MH-S macrophage PDE2A and iNOS expression by Western blot with densitometric analysis measured after 12 h of exposure to an increasing concentration of ANP administered with LPS (100 ng/ml).
The PDE2A and iNOS protein levels are normalized to GAPDH loading control and then to control MH-S cells not exposed to LPS or ANP (n=6 independent experiments). Values are means ± se. #P < 0.03 versus control cells; *P < 0.001 versus iNOS expression following LPS with no ANP; †P < 0.001 versus iNOS expression in all other LPS-treated groups.
Figure 5.
Figure 5.. Effect of down- or up-regulating PDE2A expression on MH-S macrophage PDE2A and iNOS expression by Western blot with densitometric analysis measured after 12 h of exposure to an increasing concentration of ANP administered with LPS (100 ng/ml).
Ad.Neg-shRNA, Ad.PDE2A-shRNA, or Ad.PDE2A were administered 48 h before ANP/LPS. The PDE2A and iNOS protein levels are normalized to GAPDH loading control and then to control Ad treatment in the absence of ANP (n=8 independent experiments). Values are means ± se. *P < 0.05 versus 0 ANP value within each adenoviral treatment group; #P < 0.001 versus Ad.Neg-shRNA treatment groups.
Figure 6.
Figure 6.. Effect of 8-pCPT-cGMP and 8-CPT-cAMP on MH-S macrophage PDE2A and iNOS expression by Western blot with densitometric analysis measured after 8 h of exposure to LPS (100 ng/ml).
The PDE2A and iNOS protein levels are normalized to GAPDH loading control and then to control cells not exposed to LPS or cyclic nucleotide analog (n=3 independent experiments). Values are means ± se. *P < 0.005 versus 0 cyclic nucleotide value within each treatment group; #P < 0.002 versus 8-pCPT-cGMP by ANOVA interaction.
Figure 7.
Figure 7.. Effect of down- or up-regulating PDE2A expression on mouse AM PDE2A and iNOS expression by Western blot with densitometric analysis of iNOS expression.
AMs were obtained by lavage 6 days after pharyngeal-LPS (2.5 mg/g body weight) and 3 days after IT installation of Ad.PDE2A-shRNA, Ad.PDE2A, or water diluent. The isolated AMs were exposed to an additional 18 h of LPS (100 ng/ml) in vitro before processing. (A) Mouse AM homogenates from four mice were combined to generate the PDE2A and B-actin blots. (B) iNOS and B-actin blots are representative blots from a single mouse with densitometric analysis (n=4 mice). Values are means ± se. *P < 0.0001 versus all other groups.

References

    1. Lane C., Knight D., Burgess S., Franklin P., Horak F., Legg J., Moeller A., Stick S. (2004) Epithelial inducible nitric oxide synthase activity is the major determinant of nitric oxide concentration in exhaled breath. Thorax 59, 757–760. - PMC - PubMed
    1. Warner R. L., Paine R., III, Christensen P. J., Marletta M. A., Richards M. K., Wilcoxen S. E., Ward P. A. (1995) Lung sources and cytokine requirements for in vivo expression of inducible nitric oxide synthase. Am. J. Respir. Cell Mol. Biol. 12, 649–661. - PubMed
    1. Kobzik L., Bredt D. S., Lowenstein C. J., Drazen J., Gaston B., Sugarbaker D., Stamler J. S. (1993) Nitric oxide synthase in human and rat lung: immunocytochemical and histochemical localization. Am. J. Respir. Cell Mol. Biol. 9, 371–377. - PubMed
    1. Kleinert H., Schwarz P. M., Forstermann U. (2003) Regulation of the expression of inducible nitric oxide synthase. Biol. Chem. 384, 1343–1364. - PubMed
    1. Galea E., Feinstein D. L. (1999) Regulation of the expression of the inflammatory nitric oxide synthase (NOS2) by cyclic AMP. FASEB J. 13, 2125–2137. - PubMed

Publication types

MeSH terms

Substances