. 2014 Oct:75:230-40.
doi: 10.1016/j.freeradbiomed.2014.07.021. Epub 2014 Jul 23.

Oxidative stress-mediated activation of extracellular signal-regulated kinase contributes to mild cognitive impairment-related mitochondrial dysfunction

Affiliations

Oxidative stress-mediated activation of extracellular signal-regulated kinase contributes to mild cognitive impairment-related mitochondrial dysfunction

Xueqi Gan et al. Free Radic Biol Med. 2014 Oct.

Abstract

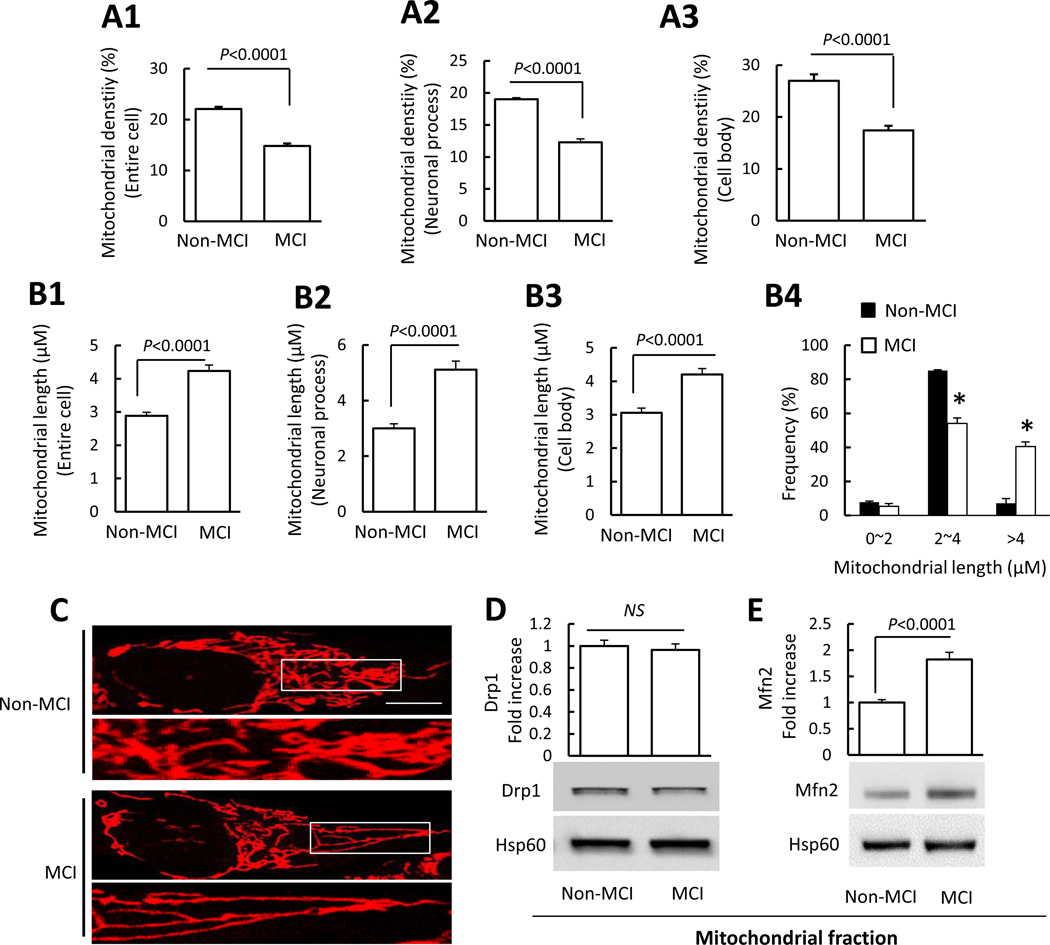
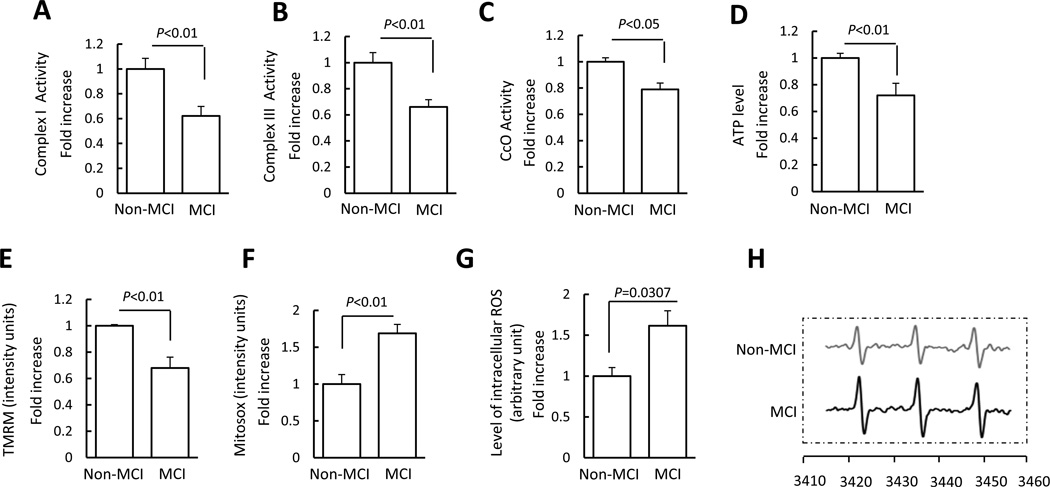
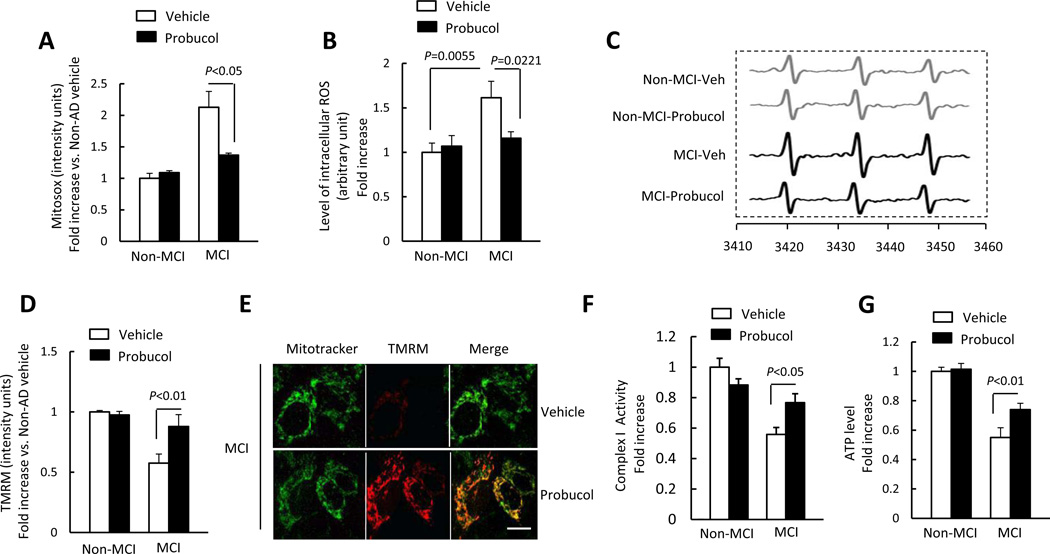
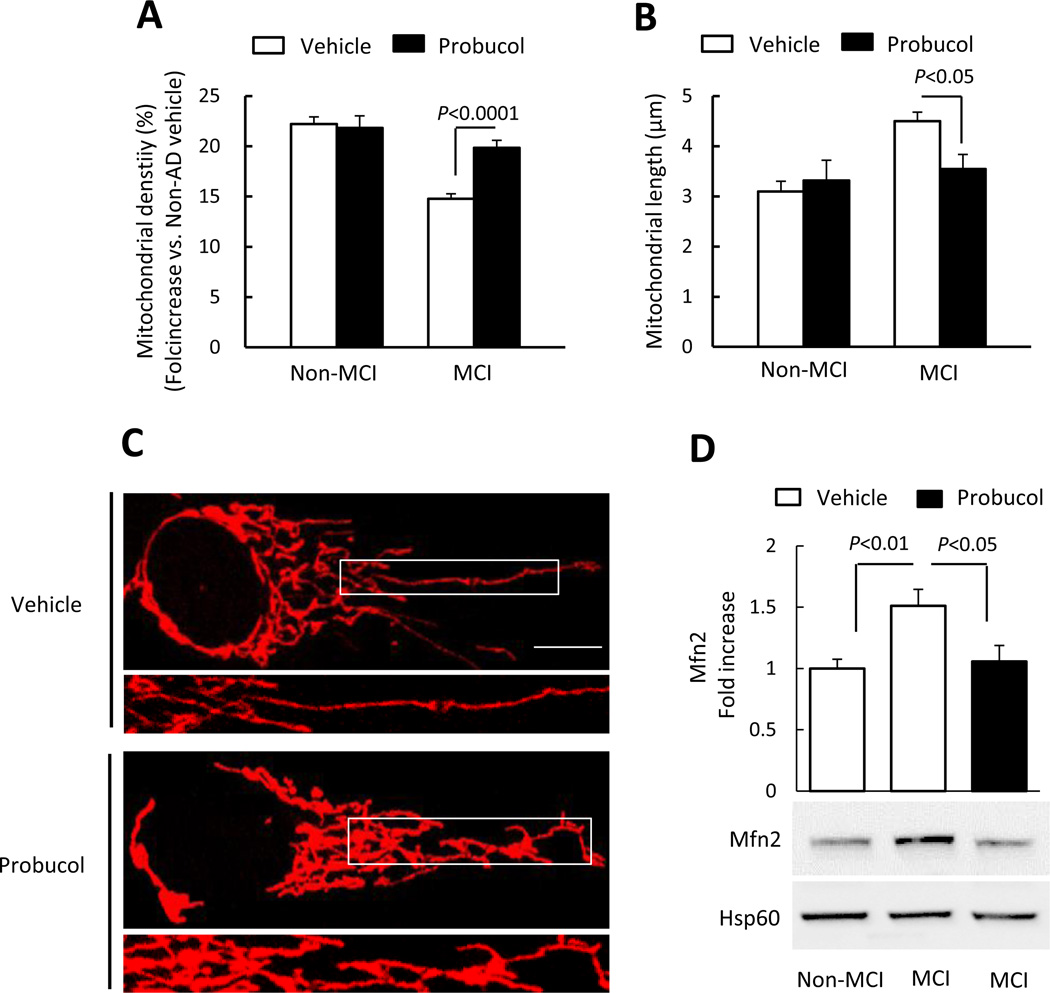
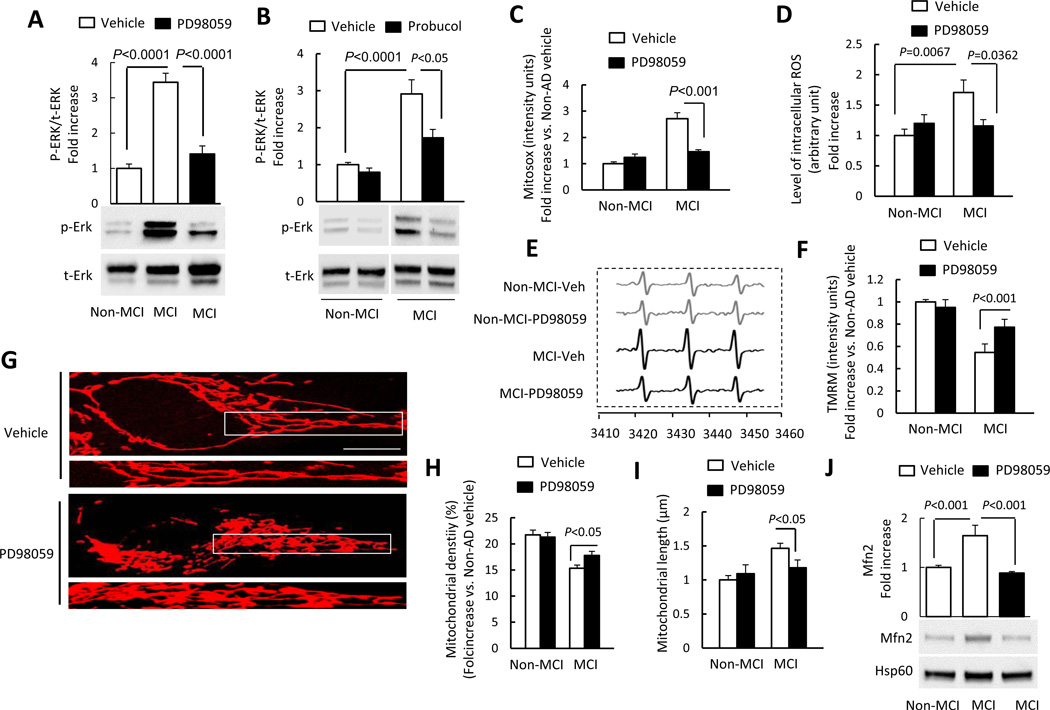
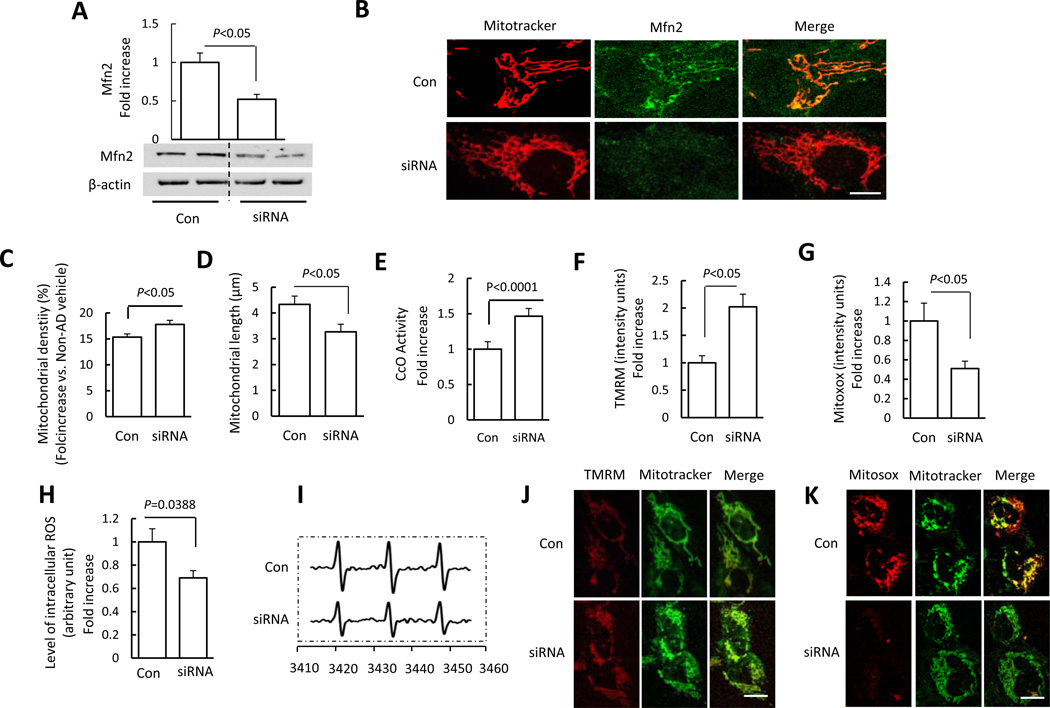
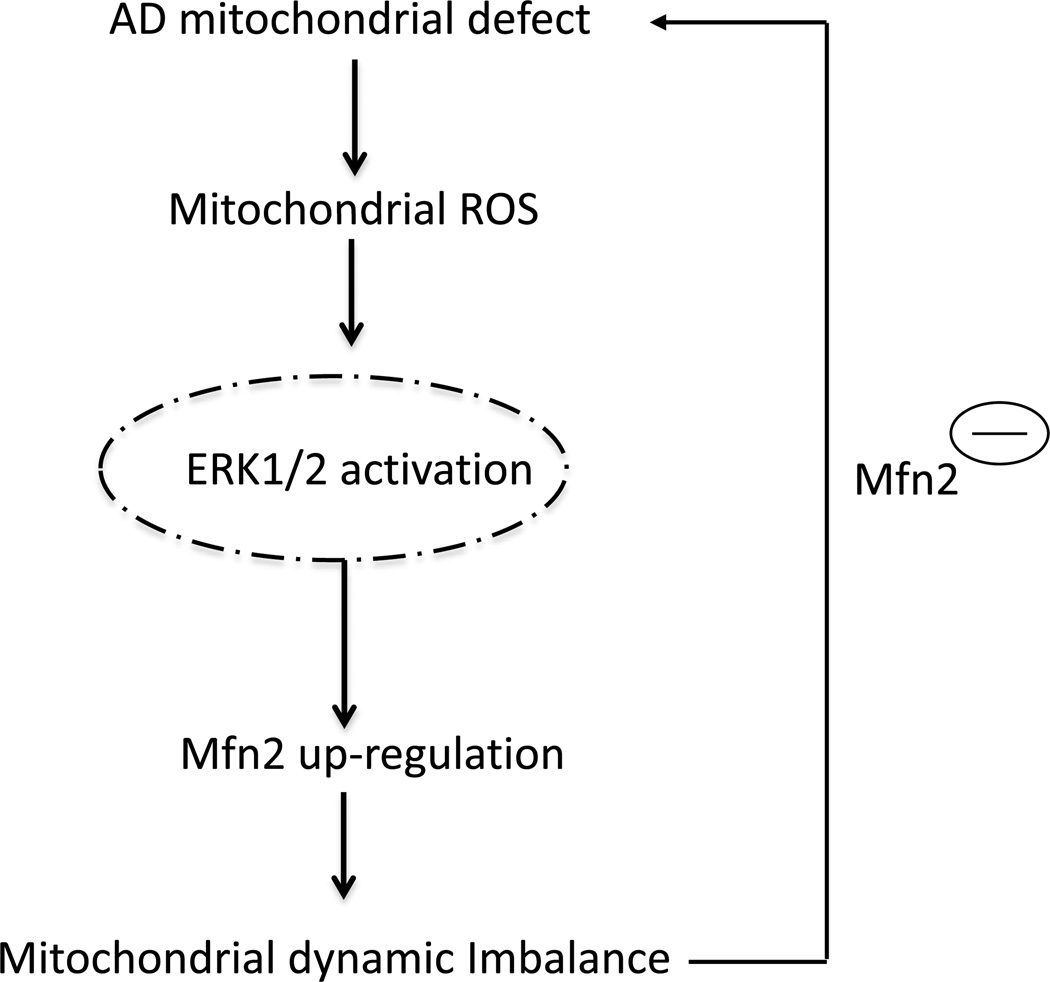
Mild cognitive impairment (MCI) occurs during the predementia stage of Alzheimer disease (AD) and is characterized by a decline in cognitive abilities that frequently represents a transition between normal cognition and AD dementia. Its pathogenesis is not well understood. Here, we demonstrate the direct consequences and potential mechanisms of oxidative stress and mitochondrial dynamic and functional defects in MCI-derived mitochondria. Using a cytoplasmic hybrid (cybrid) cell model in which mitochondria from MCI or age-matched non-MCI subjects were incorporated into a human neuronal cell line depleted of endogenous mitochondrial DNA, we evaluated the mitochondrial dynamics and functions, as well as the role of oxidative stress in the resultant cybrid lines. We demonstrated that increased expression levels of mitofusin 2 (Mfn2) are markedly induced by oxidative stress in MCI-derived mitochondria along with aberrant mitochondrial functions. Inhibition of oxidative stress rescues MCI-impaired mitochondrial fusion/fission balance as shown by the suppression of Mfn2 expression, attenuation of abnormal mitochondrial morphology and distribution, and improvement in mitochondrial function. Furthermore, blockade of MCI-related stress-mediated activation of extracellular signal-regulated kinase (ERK) signaling not only attenuates aberrant mitochondrial morphology and function but also restores mitochondrial fission and fusion balance, in particular inhibition of overexpressed Mfn2. Our results provide new insights into the role of the oxidative stress-ERK-Mfn2 signal axis in MCI-related mitochondrial abnormalities, indicating that the MCI phase may be targetable for the development of new therapeutic approaches that improve mitochondrial function in age-related neurodegeneration.

Keywords: Cybrid cells; ERK; Free radicals; Mfn2; Mild cognitive impairment; Mitochondrial fission; Mitochondrial fusion; Oxidative stress.


Conflict of interest statement

Conflict of Interest

The authors have no conflict of interest to disclose.

Figures

Figure 1
Figure 1
Abnormal mitochondrial morphology in MCI cybrid cells. Cybrid cells were labeled with Mitotracker Red for visualization of mitochondrial morphology. (A1–A3) Quantitative measurement of mitochondrial density (using NIH ImageJ software) presented as the percentage of area occupied by mitochondria in entire cells (A1), neuronal process (A2), or cell body (A3). (B1–B3) Average mitochondrial length throughout the entire cell, neuronal processes, and cell body was higher in MCI cybrid cells compared to Non-MCI cells. (B4) Quantification of mitochondrial size based on the grouped differently sized bins. (C) Representative images of Mitotracker Red staining. Lower panels present larger images corresponding to the indicated images above. Scale bar = 5 µm. N = 7 cell lines/group. (D–E) Drp1 and Mfn2 expression levels in Non-MCI and MCI cybrid mitochondria. Densitometry of immunoreactive bands for Drp1 (D) and Mfn2 (E) in mitochondrial fractions of the indicated groups of cybrid cells. Data are expressed as fold-increase of Drp1 or Mfn2 relative to Non-MCI cells. Drp1 andMfn2 levels were normalized to mitochondrial marker Hsp60. Representative immunoblots are shown underneath. N = 7 cell lines/group.
Figure 2
Figure 2
Mitochondrial dysfunction in MCI cybrid cells. (A–D) Enzymatic activity of complex I, III, and IV (CcO), and ATP levels were determined in cell lysates from indicated cell groups. (E–F) Mitochondrial membrane potential and reactive oxygen species (ROS) were measured by tetramethylrhodamine methyl ester (TMRM) (E) and Mitosox staining intensity (F), respectively. Image intensity was quantified using NIH ImageJ software. (G) The production of the intracellular ROS determined by EPR spectroscopy in Non-MCI and MCI cybrids. (H) Representative spectra of EPR. The peak height in the spectrum indicates the level of reactive oxygen species (ROS). Data are expressed as fold increase relative to Non-MCI cybrid cells. N = 7 cell lines/group.
Figure 3
Figure 3
Effect of antioxidant treatment on mitochondrial function and morphology. (A–C) Cells were treated with probucol (10 µM) for 24 h and then stained with Mitosox to determine mitochondrial ROS levels, or tested EPR values to evaluate intracellular ROS production. Quantification of staining intensity for Mitosox (A), EPR values (B), and representative EPR spectra (C). Mitochondrial membrane potential was shown as the quantification of staining intensity of TMRM (D) and representative images with TMRM staining (Scale bar = 10 µm) (E). (F–G) Complex I activity (F) and ATP levels (G) were measured in the indicated groups of cells with or without probucol treatment. Data are expressed as fold increase relative to vehicle treated Non-MCI cybrid cells. N = 7 cell lines/group.
Figure 4
Figure 4
(A–B) Quantitative measurement of mitochondrial density (A) and average mitochondrial length (B) in the indicated cell groups using NIH ImageJ software. (C) Representative images of Mitotracker Red staining. Lower panels present larger images corresponding to the indicated images above (Scale bar = 5µM). (D) Quantification of immunoreactive bands for Mfn2 relative to Hsp60 in the indicated cell groups with probucol or vehicle treatment using NIH ImageJ software. Data are expressed as fold increase relative to vehicle-treated Non-MCI cybrid cells. Representative immunoblots are shown in the lower panel. N = 5–7 cell lines/group.
Figure 5
Figure 5
Inhibition of ERK activation rescued abnormal mitochondrial function and morphology. (A–B) Densitometry of immunoreactive bands for phospho-ERK1/2 (p-ERK1/2) using NIH Image J software, normalized to total-ERK1/2 (t-ERK1/2) in indicated cell groups treated with PD98059 (10 µM for 2 h) (A), probucol (10 µM for 24 h) (B), or vehicle. Representative immunoblots are shown in lower panel. (C) PD98059 treatment decreased Mitosox staining intensity in MCI cybrid cells compared to vehicle treatment. (D–E) PD98059 treatment decreased intracellular ROS production in MCI cybrids compared to vehicle treatment measured by EPR. Quantification of EPR values in the indicated cybrid cells (D). (E) Representative EPR spectra. (F) TMRM staining intensity was significantly increased in MCI cybrid cells treated with PD98059. (G–I) Effects of ERK inhibitor on mitochondrial morphology. Representative images are shown for Mitotracker Red staining. The lower panel is a larger image corresponding to the indicated image above (Scale bar = 5 µm) (G). Mitochondrial density (H) and average length (I) were measured in the indicated cell groups treated with PD98059 or vehicle. (J) Quantification of immunoreactive bands for Mfn2 normalized to Hsp60 in mitochondrial fractions of the indicated cell group with PD98059 or vehicle treatment. Representative immunoblots are shown in lower panel. Data are expressed as fold increase relative to vehicle-treated Non-MCI cybrid cells. N = 5–7 cell lines/group.
Figure 6
Figure 6
Effect of Mfn2 blockade on MCI mitochondrial morphology and function. (A) Quantification of immunoreactive bands for Mfn2 normalized to β-actin in MCI cybrid cell lysate of the indicated group with siRNA-control and siRNA-Mfn2 transfection. Representative immunoblots are shown in the lower panel. Data are expressed as fold increase relative to siRNA-control transfected MCI cybrid cells. (B) MCI cybrid cells were transfected with siRNA-control or siRNA-Mfn2. After 24 h, cells were incubated with Mitotracker Red to analyze mitochondrial morphology using confocal microscopy (Scale bar = 5 µm). siRNA-Mfn2 transfected MCI cybrids had tubular mitochondria, whereas siRNA-control transfected cells retained elongated mitochondrial morphology. Mitochondrial average density (C), length (D), and CcO activity (E), and mitochondrial membrane potential (TMRM) (F) were restored in siRNA-Mfn2 transfected cells compared to siRNA- transfected control cells. ROS production measured by Mitosox (G) and EPR values (H, I) were suppressed in siRNA-Mfn2 transfected cells compared to siRNA-transfected control cells. (H) Quantification of EPR values in the indicated groups of cells. (I) Representative EPR spectra. (J,K) Representative images for Mitotracker and Mitosox staining are shown (Scale bar = 10 µm). N = 5–7 cell lines/group.
Figure 7
Figure 7
Schematic diagram showing sequence in which defects in MCI mitochondrial respiratory function result in increased mitochondrial ROS generation/accumulation stems; this in turn leads to activation of ERK signal transduction. ERK activation directly or indirectly disrupts the balance of mitochondrial dynamics (fusion and fission events) and results in altered Mfn2 expression levels, eventually leading to aberrant mitochondrial morphology and function. Genetic knockdown of Mfn2 expression rescues perturbation of mitochondrial morphology and function relevant to MCI mitochondrial degeneration.

References

    1. Petersen RC. Mild cognitive impairment: transition between aging and Alzheimer's disease. Neurologia. 2000;15:93–101. - PubMed
    1. Karakaya T, Fusser F, Schroder J, Pantel J. Pharmacological Treatment of Mild Cognitive Impairment as a Prodromal Syndrome of Alzheimer s Disease. Current neuropharmacology. 2013;11:102–108. - PMC - PubMed
    1. DeCarli C. Mild cognitive impairment: prevalence, prognosis, aetiology, and treatment. Lancet neurology. 2003;2:15–21. - PubMed
    1. Bowen J, Teri L, Kukull W, McCormick W, McCurry SM, Larson EB. Progression to dementia in patients with isolated memory loss. Lancet. 1997;349:763–765. - PubMed
    1. Petersen RC, Stevens JC, Ganguli M, Tangalos EG, Cummings JL, DeKosky ST. Practice parameter: early detection of dementia: mild cognitive impairment (an evidence-based review). Report of the Quality Standards Subcommittee of the American Academy of Neurology. Neurology. 2001;56:1133–1142. - PubMed

Publication types

MeSH terms

Substances