. 2014 Aug 7;8(3):688-95.
doi: 10.1016/j.celrep.2014.06.045. Epub 2014 Jul 24.

Heterogeneous tumor subpopulations cooperate to drive invasion

Affiliations

Heterogeneous tumor subpopulations cooperate to drive invasion

Anna Chapman et al. Cell Rep. .

Abstract

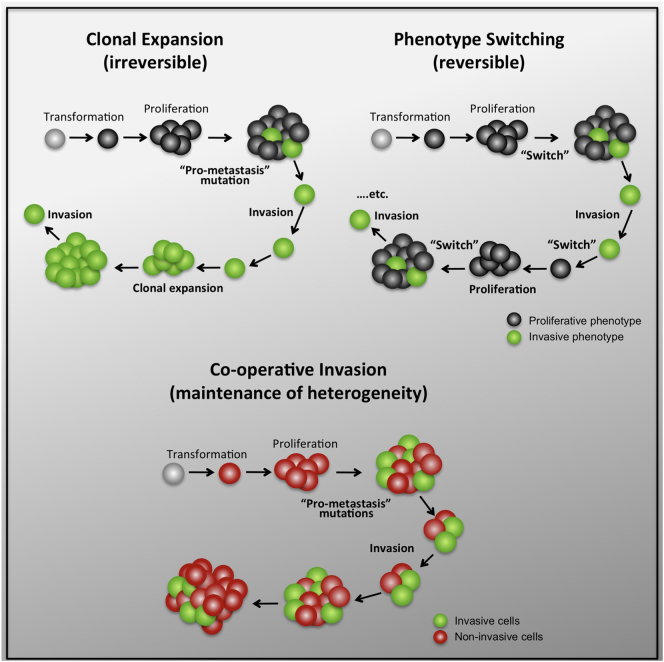
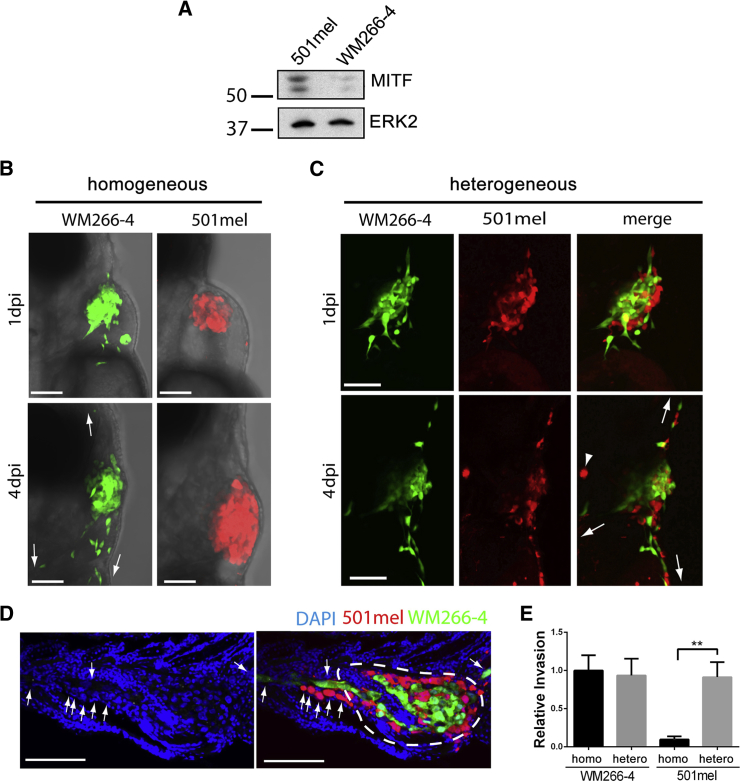
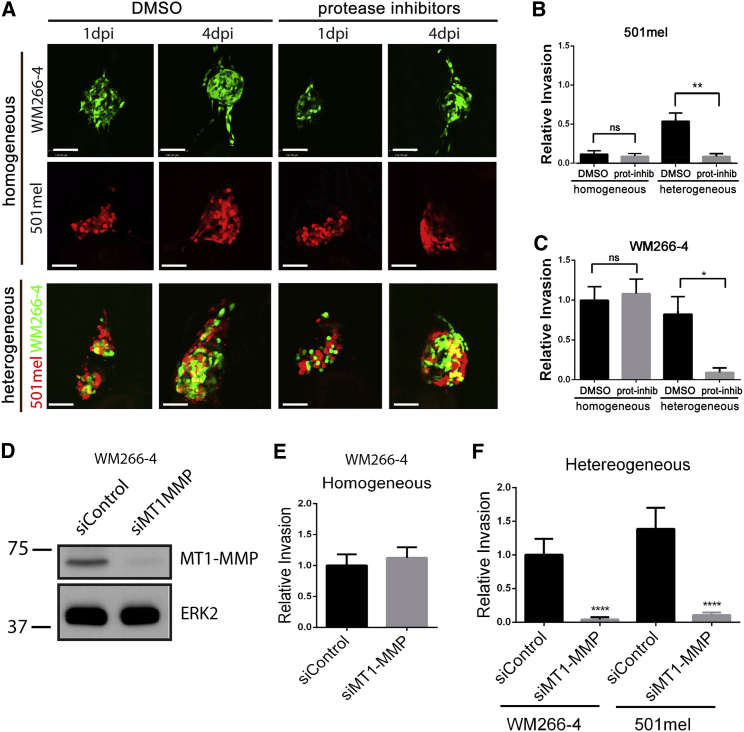
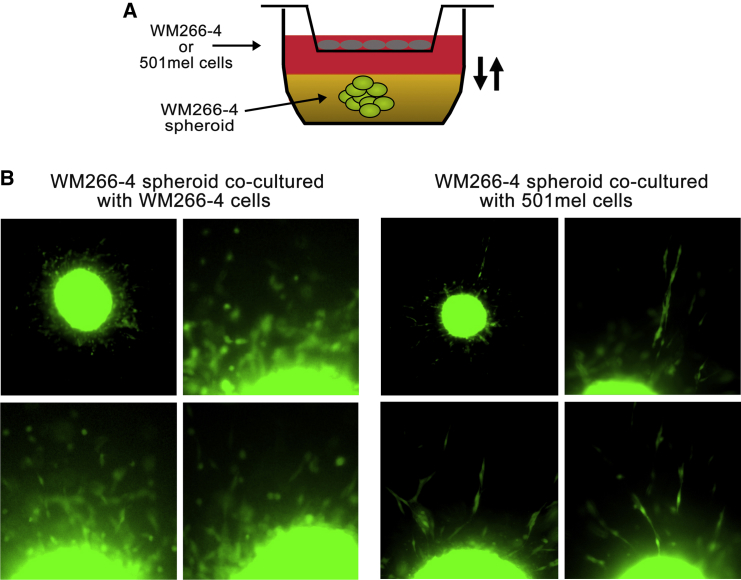
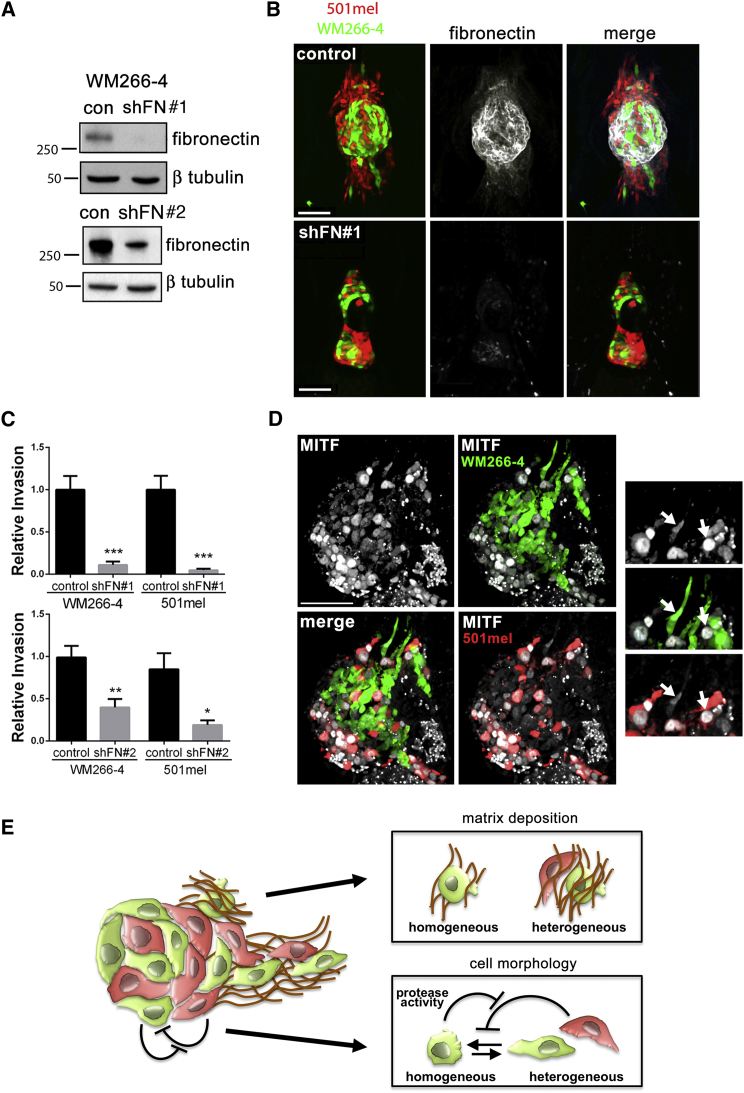
Clonal selection and transcriptional reprogramming (e.g., epithelial-mesenchymal transition or phenotype switching) are the predominant theories thought to underlie tumor progression. However, a "division of labor" leading to cooperation among tumor-cell subpopulations could be an additional catalyst of progression. Using a zebrafish-melanoma xenograft model, we found that in a heterogeneous setting, inherently invasive cells, which possess protease activity and deposit extracellular matrix (ECM), co-invade with subpopulations of poorly invasive cells, a phenomenon we term "cooperative invasion". Whereas the poorly invasive cells benefit from heterogeneity, the invasive cells switch from protease-independent to an MT1-MMP-dependent mode of invasion. We did not observe changes in expression of the melanoma phenotype determinant MITF during cooperative invasion, thus ruling out the necessity for phenotype switching for invasion. Altogether, our data suggest that cooperation can drive melanoma progression without the need for clonal selection or phenotype switching and can account for the preservation of heterogeneity seen throughout tumor progression.


Figures

None
Graphical abstract
Figure 1
Figure 1
Heterogeneity Results in Cooperative Invasion (A) Western blot showing MITF expression in WM266-4 and 501mel cells. (B) Homogeneous xenografts imaged at 1 (upper) and 4 days (lower) postinjection (dpi). (C) Heterogeneous xenografts imaged at 1 (upper) and 4 dpi (lower). Arrows indicate directions of invasion; arrowhead indicates autofluorescence. (D) Section from engrafted embryo indicating primary tumor site (white dashed line) and infiltrating melanoma cells (white arrows). Scale bars represent 100 μm. (E) Quantitation of invasion depicted in (A) and (B); mean ± SEM; Kruskal-Wallis test followed by Dunn’s multiple comparisons test; ∗∗p < 0.01; n ≥ 26 from three independent experiments. See also Figure S1.
Figure 2
Figure 2
MMP Inhibition Suppresses Cooperative Invasion (A) Homogeneous (upper) or heterogeneous (bottom) xenografts were treated with either the vehicle control DMSO (left) or protease inhibitor cocktail (right). Scale bars represent 100 μm. (B) Quantitation of 501mel invasion depicted in (A); mean ± SEM; Kruskal-Wallis test followed by Dunn’s multiple comparisons test; ∗∗p < 0.01; n ≥ 9 from three independent experiments. (C) Quantitation of WM266-4 invasion depicted in (A); mean ± SEM; Kruskal-Wallis test followed by Dunn’s multiple comparisons test; p < 0.05; n ≥ 13 from three independent experiments. (D) Western blot showing MT1-MMP expression in WM266-4 transfected with either control or MT1-MMP specific siRNA. (E) Quantitation of invasion of WM266-4 cells in homogeneous xenografts wherein WM266-4 cells have been transfected with either control or MT1-MMP-specific siRNA; mean ± SEM; Mann-Whitney test; n ≥ 21 from three independent experiments. (F) Quantitation of invasion of WM266-4 and 501mel in heterogeneous xenografts wherein WM266-4 cells have been transfected with either control or MT1-MMP specific siRNA; mean ± SEM; Kruskal-Wallis test followed by Dunn’s multiple comparisons test; ∗∗∗∗p < 0.0001; n ≥ 24 from three independent experiments. See also Figure S2.
Figure 3
Figure 3
A Diffusible Factor Emanating from 501mel Cells Modulates WM266-4 Cell Response to Protease Inhibitors (A) Cartoon depicting experimental set-up, with WM266-4 spheroids being cocultured either with autologous cells or heterologous cells in porous transwells. (B) Representative images of WM266-4 spheroids cocultured either with WM266-4 or 501mel cells in the presence of a cocktail of protease inhibitors.
Figure 4
Figure 4
ECM Proteins Correlate with Invasiveness (A) Expression of ECM components collagen I and fibronectin in engrafted zebrafish 4 dpi; arrows indicate direction of invasion. (B) Western blot showing collagen I and fibronectin expression in WM266-4 and 501mel cells. (C) Collagen I (upper) and fibronectin (lower) in homogeneous compared to heterogeneous xenografts that are further treated with either DMSO or GM6001. (D) Invasive WM266-4 and 501mel follow collagen I (upper) and fibronectin (lower) tracks radiating out from the tumor. (E) Quantitation of ECM association. Cells were scored as being in touch “on” with collagen I or fibronectin strands or not “off.” Mean ± SEM; unpaired Student’s t test (collagen) and Mann-Whitney test (fibronectin); ∗∗∗∗p < 0.0001; n ≥ 18 from three independent experiments. Scale bars represent 100 μm. See also Figure S3.
Figure 5
Figure 5
Fibronectin Is Essential for Cooperative Invasion; Invasive Primary Melanoma Cells Are Also Heterogeneous (A) Western blot showing stable knockdown of fibronectin in WM266-4 GFP shFN cells. #1 and #2 are clones expressing independent shRNA targeting fibronectin. Control (con) cells express an irrelevant shRNA. (B) Fibronectin associated with heterogeneous xenografts comprising either control WM266-4 cells (upper) or WM266-4 shFN#1 cells (lower). (C) Quantitation of invasion of 501mel and WM266-4 cells from heterogeneous xenografts comprising either control WM266-4 cells, WM266-4 shFN#1, or WM266-4 shFN#2 cells. Mean ± SEM; Mann-Whitney test; p < 0.05, ∗∗p < 0.001, ∗∗∗p < 0.001; n ≥ 18 from three independent experiments. (D) MITF immunofluorescence in frozen sections of heterogeneous xenografts. Arrows indicate high and low MITF fluorescence intensity in invading cells. (E) Model depicting the reciprocal interactions underlying cooperative invasion. See also Figures S4 and S5.

Comment in

References

    1. Arozarena I., Bischof H., Gilby D., Belloni B., Dummer R., Wellbrock C. In melanoma, beta-catenin is a suppressor of invasion. Oncogene. 2011;30:4531–4543. - PMC - PubMed
    1. Carreira S., Goodall J., Denat L., Rodriguez M., Nuciforo P., Hoek K.S., Testori A., Larue L., Goding C.R. Mitf regulation of Dia1 controls melanoma proliferation and invasiveness. Genes Dev. 2006;20:3426–3439. - PMC - PubMed
    1. Cleary A.S., Leonard T.L., Gestl S.A., Gunther E.J. Tumour cell heterogeneity maintained by cooperating subclones in Wnt-driven mammary cancers. Nature. 2014;508:113–117. - PMC - PubMed
    1. Friedland J.C., Lee M.H., Boettiger D. Mechanically activated integrin switch controls alpha5beta1 function. Science. 2009;323:642–644. - PubMed
    1. Gaggioli C., Deckert M., Robert G., Abbe P., Batoz M., Ehrengruber M.U., Ortonne J.P., Ballotti R., Tartare-Deckert S. HGF induces fibronectin matrix synthesis in melanoma cells through MAP kinase-dependent signaling pathway and induction of Egr-1. Oncogene. 2005;24:1423–1433. - PubMed

Publication types

Substances