

Rate of decline of antibody titers to pandemic influenza A (H1N1-2009) by hemagglutination inhibition and virus microneutralization assays in a cohort of seroconverting adults in Singapore
- PMID: 25066592
- PMCID: PMC4133624
- DOI: 10.1186/1471-2334-14-414
Rate of decline of antibody titers to pandemic influenza A (H1N1-2009) by hemagglutination inhibition and virus microneutralization assays in a cohort of seroconverting adults in Singapore
Abstract
Background: The rate of decline of antibody titers to influenza following infection can affect results of serological surveys, and may explain re-infection and recurrent epidemics by the same strain.
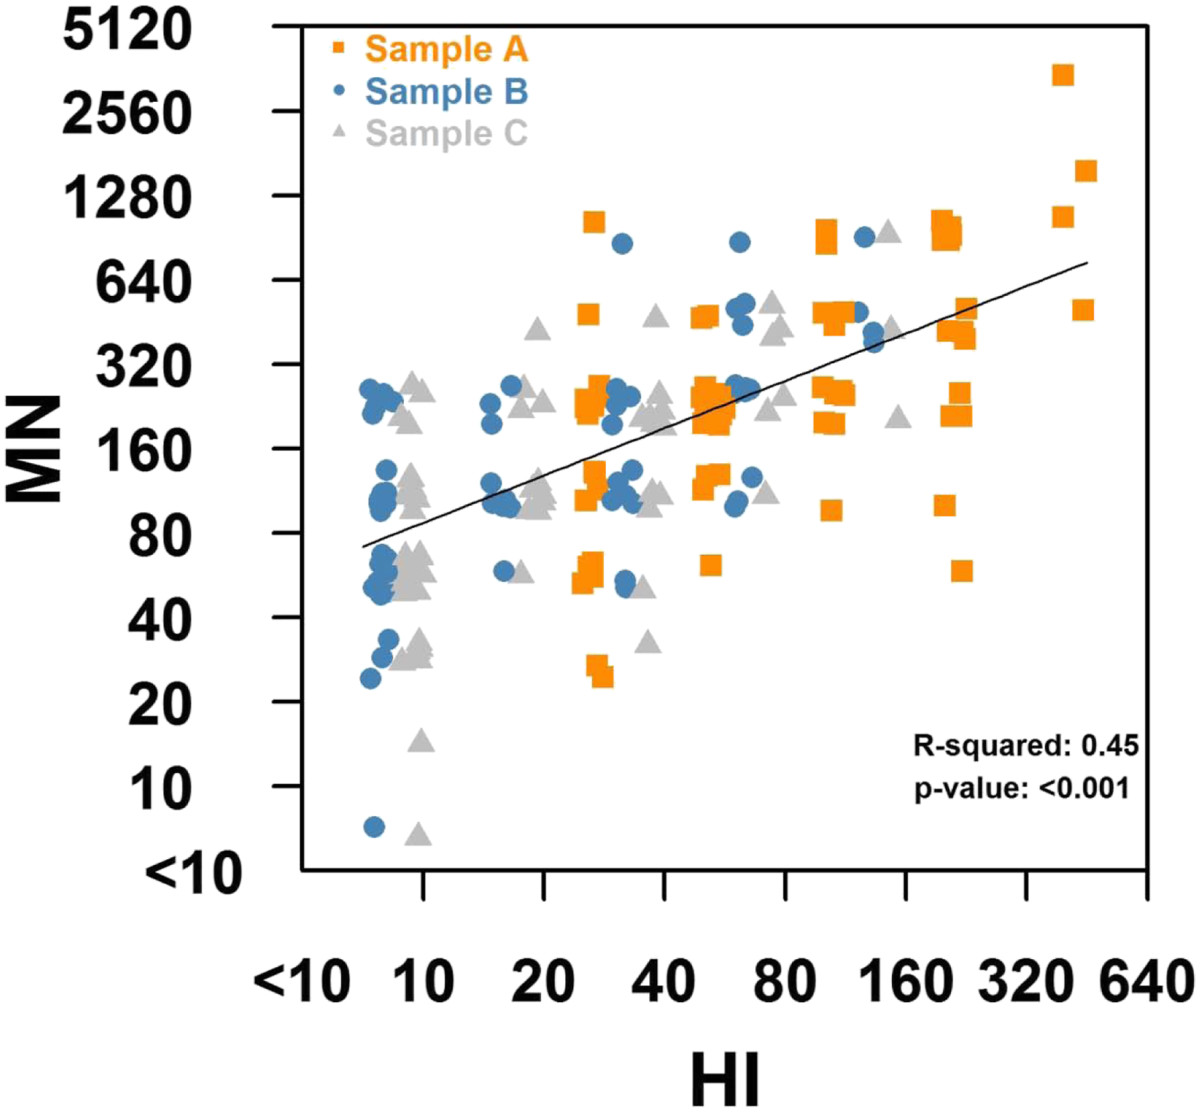
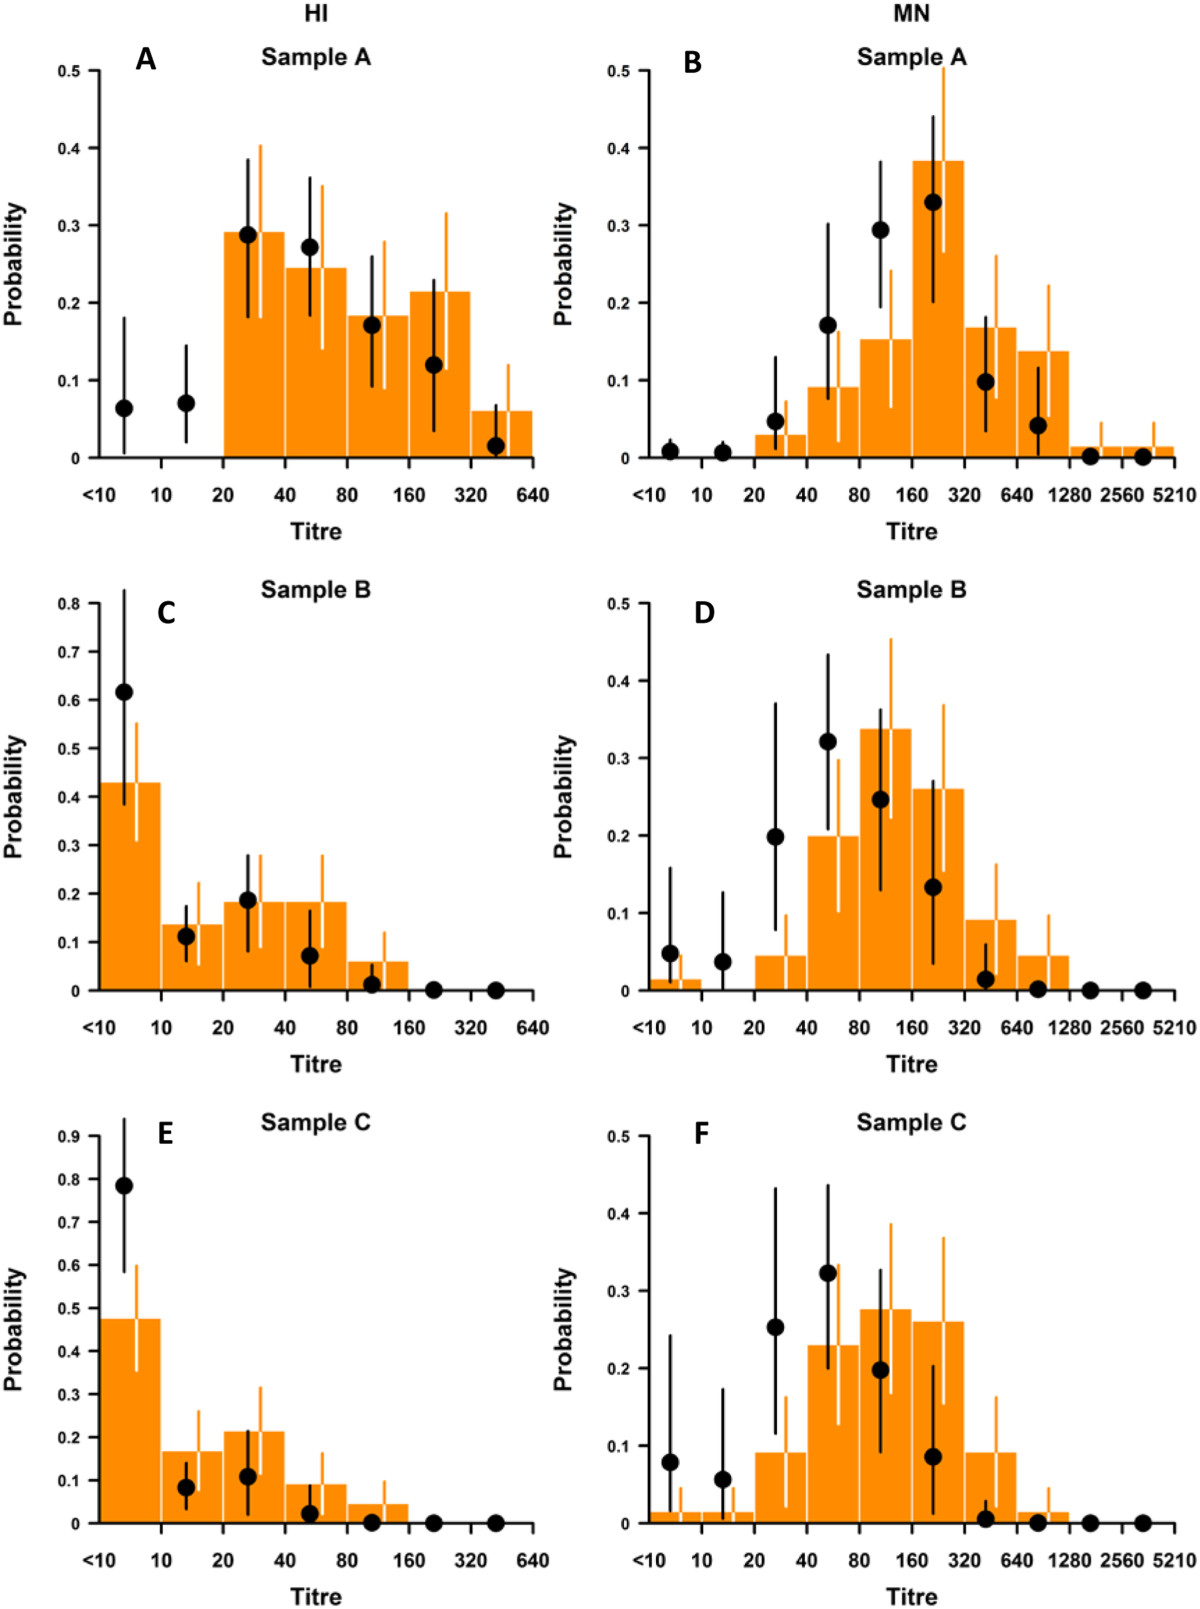
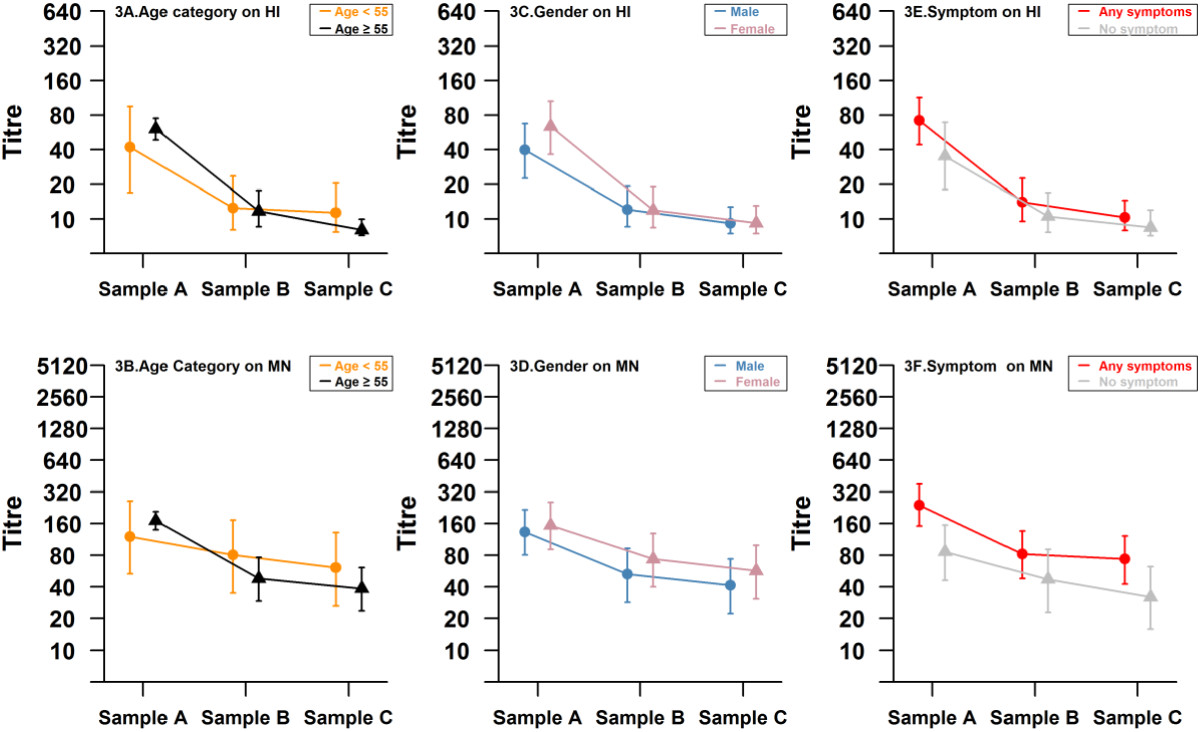
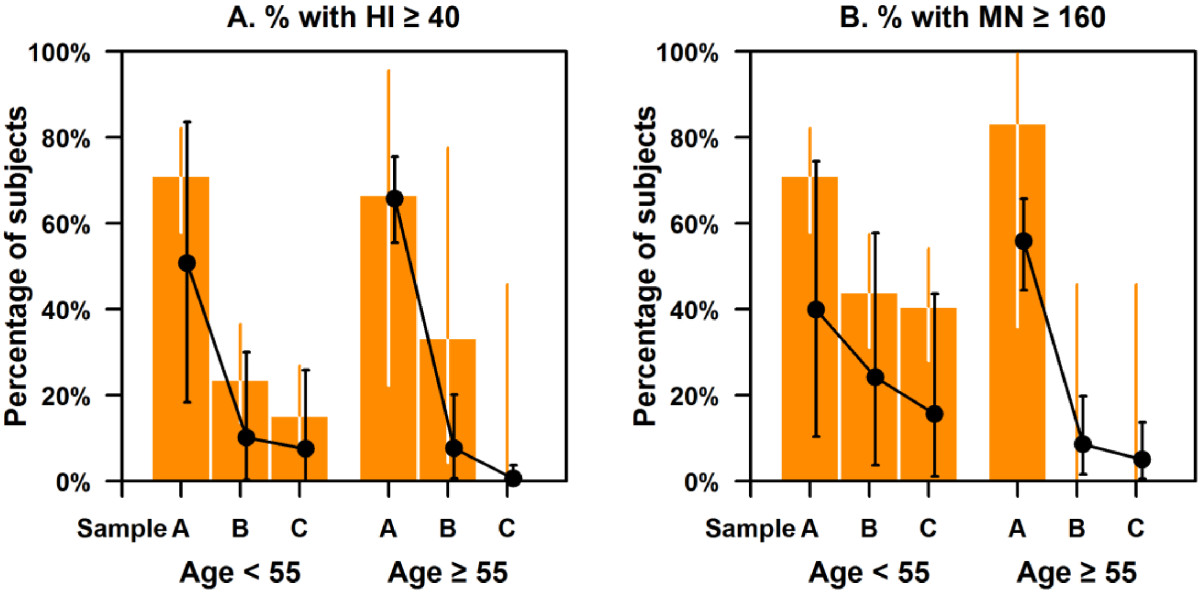
Methods: We followed up a cohort who seroconverted on hemagglutination inhibition (HI) antibody titers (≥ 4-fold increase) to pandemic influenza A(H1N1)pdm09 during a seroincidence study in 2009. Along with the pre-epidemic sample, and the sample from 2009 with the highest HI titer between August and October 2009 (A), two additional blood samples obtained in April 2010 and September 2010 (B and C) were assayed for antibodies to A(H1N1)pdm09 by both HI and virus microneutralization (MN) assays. We analyzed pair-wise mean-fold change in titers and the proportion with HI titers ≥ 40 and MN ≥ 160 (which correlated with a HI titer of 40 in our assays) at the 3 time-points following seroconversion.
Results: A total of 67 participants contributed 3 samples each. From the highest HI titer in 2009 to the last sample in 2010, 2 participants showed increase in titers (by HI and MN), while 63 (94%) and 49 (73%) had reduction in HI and MN titers, respectively. Titers by both assays decreased significantly; while 70.8% and 72.3% of subjects had titers of ≥ 40 and 160 by HI and MN in 2009, these percentages decreased to 13.9% and 36.9% by September 2010. In 6 participants aged 55 years and older, the decrease was significantly greater than in those aged below 55, so that none of the elderly had HI titers ≥ 40 nor MN titers ≥ 160 by the final sample. Due to this decline in titers, only 23 (35%) of the 65 participants who seroconverted on HI in sample A were found to seroconvert between the pre-epidemic sample and sample C, compared to 53 (90%) of the 59 who seroconverted on MN on Sample A.
Conclusions: We observed marked reduction in titers 1 year after seroconversion by HI, and to a lesser extent by MN. Our findings have implications for re-infections, recurrent epidemics, vaccination strategies, and for cohort studies measuring infection rates by seroconversion.
Figures
References
-
- Trauer JM, Bandaranayake D, Booy R, Chen MI, Cretikos M, Dowse GK, Dwyer DE, Greenberg ME, Huang QS, Khandaker G, Kok J, Laurie KL, Lee VJ, McVernon J, Walter S, Markey PG. Seroepidemiologic effects of influenza A(H1N1)pdm09 in Australia, New Zealand, and Singapore. Emerg Infect Dis. 2013;19(1):92–101. doi: 10.3201/eid1901.111643. - DOI - PMC - PubMed
-
- Chen MI, Cook AR, Lim WY, Lin R, Cui L, Barr IG, Kelso A, Chow VT, Leo YS, Hsu JP, Shaw R, Chew S, Yap JK, Phoon MC, Koh HW, Zheng H, Tan L, Lee VJ. Factors influencing infection by pandemic influenza A(H1N1)pdm09 over three epidemic waves in Singapore. Influenza Other Respir Viruses. 2013;7(6):1380–1389. doi: 10.1111/irv.12129. - DOI - PMC - PubMed
Pre-publication history
-
- The pre-publication history for this paper can be accessed here:http://www.biomedcentral.com/1471-2334/14/414/prepub
Publication types
MeSH terms
Substances
LinkOut - more resources
Full Text Sources
Other Literature Sources
Medical
Miscellaneous
