

doi: 10.1353/jhr.2013.0031.
Long Term and Spillover Effects of Health Shocks on Employment and Income
Affiliations
- PMID: 25067853
- PMCID: PMC4110210
- DOI: 10.1353/jhr.2013.0031
Item in Clipboard
Long Term and Spillover Effects of Health Shocks on Employment and Income
J Hum Resour.
2013 Fall.
Abstract
We use matching combined with difference-in-differences to identify the causal effects of sudden illness, represented by acute hospitalizations, on employment and income up to six years after the health shock using linked Dutch hospital and tax register data. An acute hospital admission lowers the employment probability by seven percentage points and results in a five percent loss of personal income two years after the shock. There is no subsequent recovery in either employment or income. There are large spillover effects: household income falls by 50 percent more than the income of the disabled person.
Figures

Average treatment effects of acute admission on probability of future hospitalization and death. Effects estimated by matching treatment cases (acute admission of 3 nights) with controls as described in Section 4. Dashed lines indicate 95 percent confidence intervals.
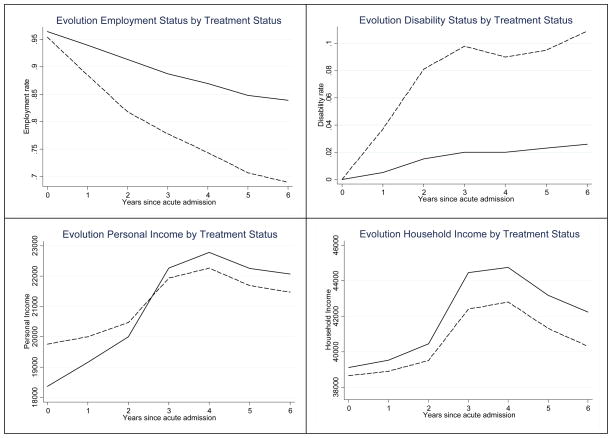
Employment, DI rates, and average incomes in post-treatment period by treatment status. Treatment is an acute hospital admission of at least three nights. All the individuals are employed in t=−1. Solid lines represent the control group, while the dashed line represents the treatment group.
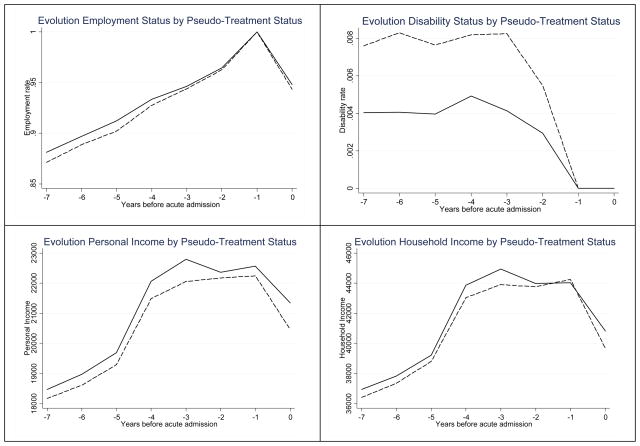
Employment/DI rates and average incomes in pre-treatment period of pseudo treatment (solid lines) and control groups (dashed lines) distinguished by acute admission in 2005. Pseudo-treatment is an acute hospital admission of at least three nights in the year 2005 (year 0). All individuals are employed in year 2004 (−1). Solid lines represent the pseudo-treatment group and dashed lines represent the pseudo-control groups.

Effects of acute hospitalization on employment status and income. ATT of acute hospital admission estimated from propensity score weighted regression DiD regression (equation 1). 95 percent confidence intervals indicated by dashed lines derived from robust standard errors that take account of individual level clustering.

Effect of acute hospitalization on personal income for individuals who remain in employment and those that move onto disability insurance. ATT of acute hospital admission estimated from propensity score weighted DiD regression. Lines as in Figure 4.

Effects of an acute hospitalization on employment status and incomes by gender. Lines as in Figure 4.
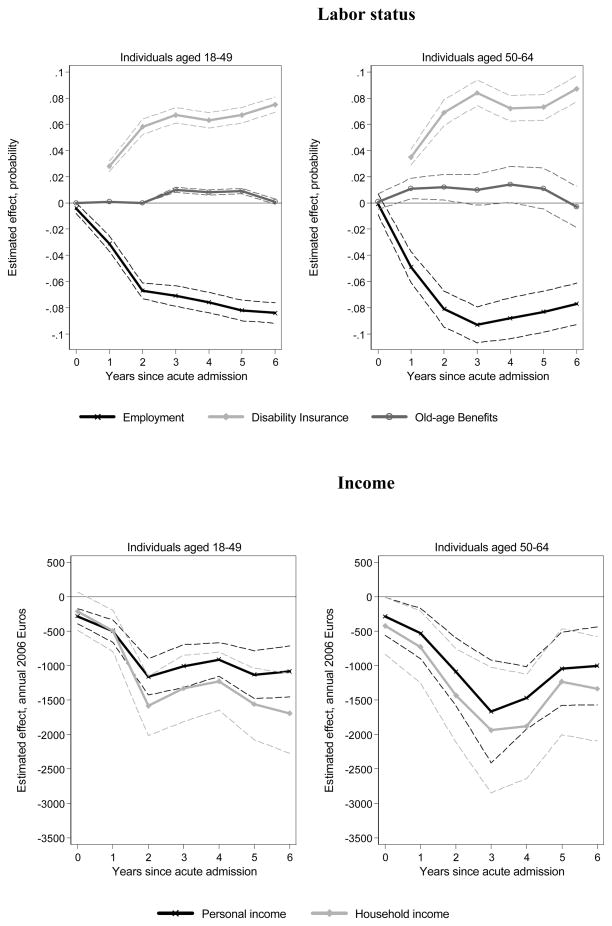
Effects of acute hospitalization on employment status and incomes by age. Lines as in Figure 4.
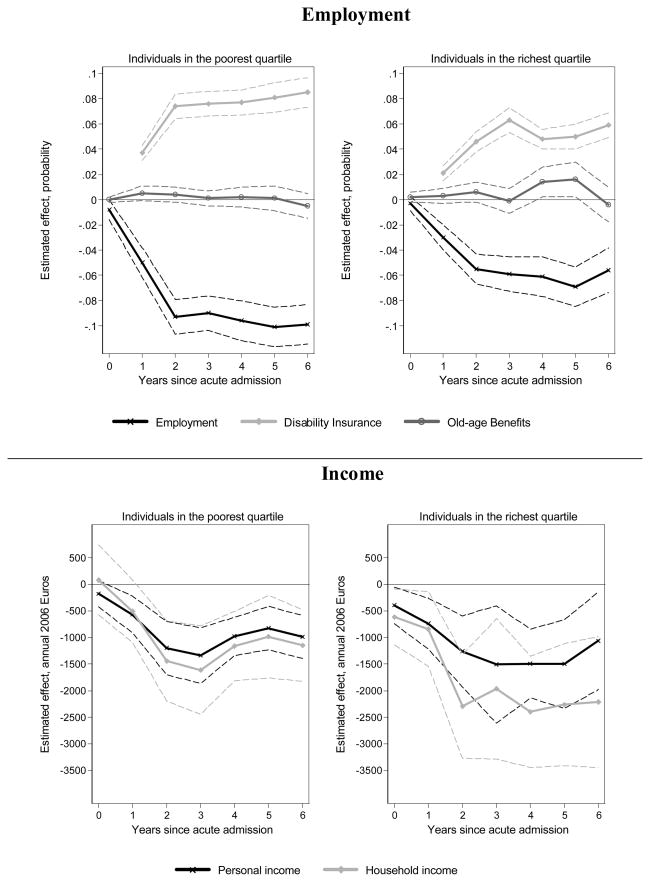
Effects of acute hospitalization on employment status and incomes by initial household income. Lines as in Figure 4. Results shown are not age-adjusted, so may reflect both income-related effects as well as age effects, as older individuals have on average higher income. The last rows of Table 2 show the effects when the population is split by income and age.

Effects of an acute hospitalization on probability of employment, disability insurance, old-age benefits (by gender). Lines as in Figure 4.
References
-
- Aarts Leo, Burkhauser Richard V, de Jong Philip R. Curing the Dutch Disease: an International Perspective on Disability Policy Reform. Aldershot, U.K: Avebury; 1996.
-
- Apps Patricia F, Rees Ray. Collective Labor Supply and Household Production. Journal of Political Economy. 1997;105(1):178–190.
-
- Banks James. Economic Capabilities, Choices and Outcomes at Older Ages. Fiscal Studies. 2006;27(3):281–311.
-
- Becker Sascha O, Ichino Andrea. Estimation of Average Treatment Effects Based on Propensity Scores. The Stata Journal. 2002;2(4):358–377.
-
- Berger Mark C. Labour Supply and Spouse’s Health: the Effects of Illness, Disability and Mortality. Social Science Quarterly. 1983;64(3):494–509.
Grants and funding
LinkOut - more resources
Full Text Sources
Other Literature Sources