. 2014 Nov;96(5):589-98.
doi: 10.1038/clpt.2014.158. Epub 2014 Jul 28.

Systems pharmacology modeling predicts delayed presentation and species differences in bile acid-mediated troglitazone hepatotoxicity

Affiliations

Systems pharmacology modeling predicts delayed presentation and species differences in bile acid-mediated troglitazone hepatotoxicity

K Yang et al. Clin Pharmacol Ther. 2014 Nov.

Abstract

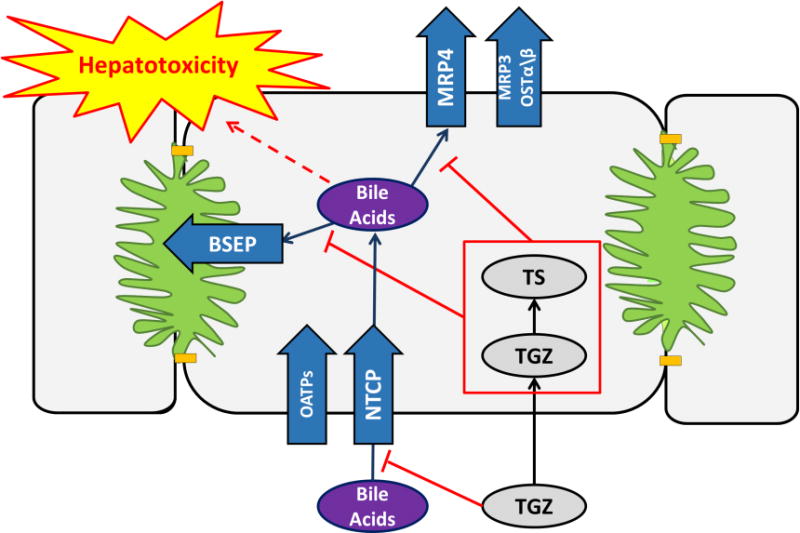
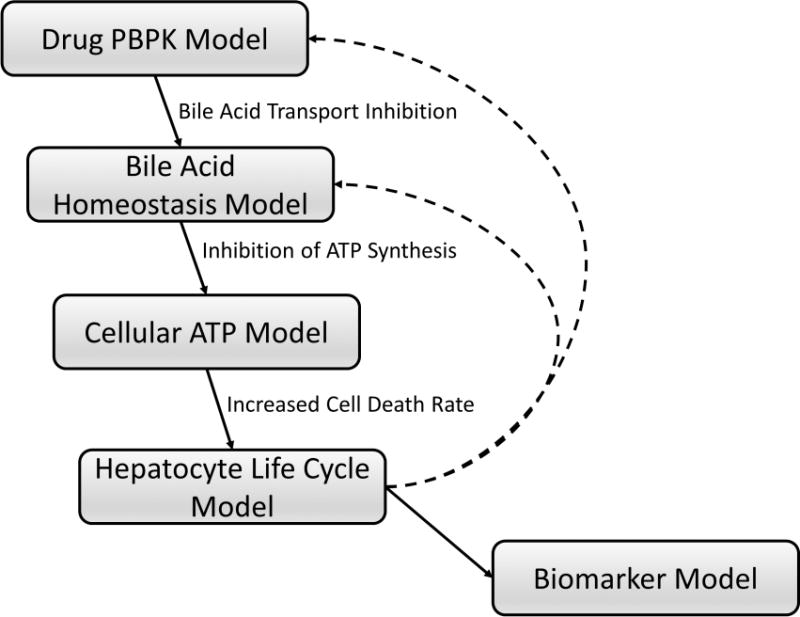
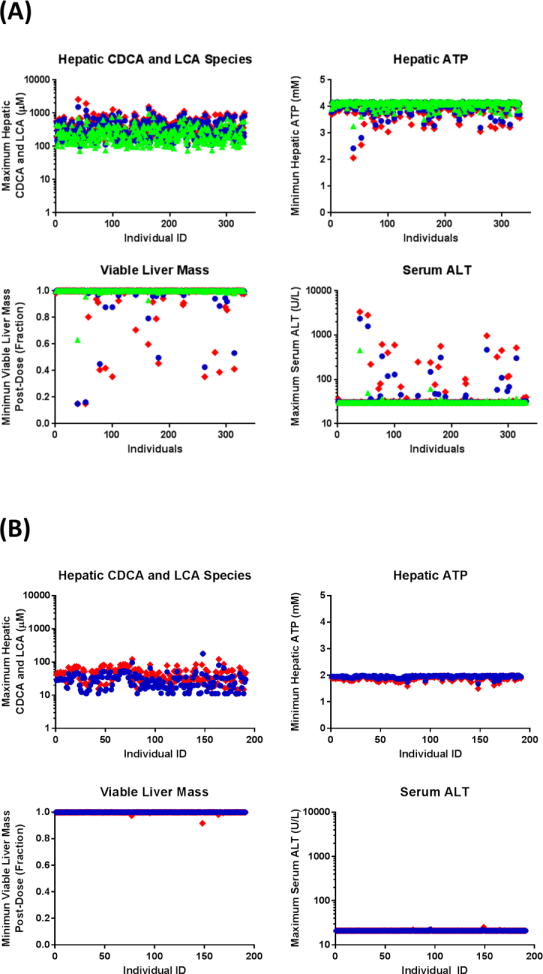
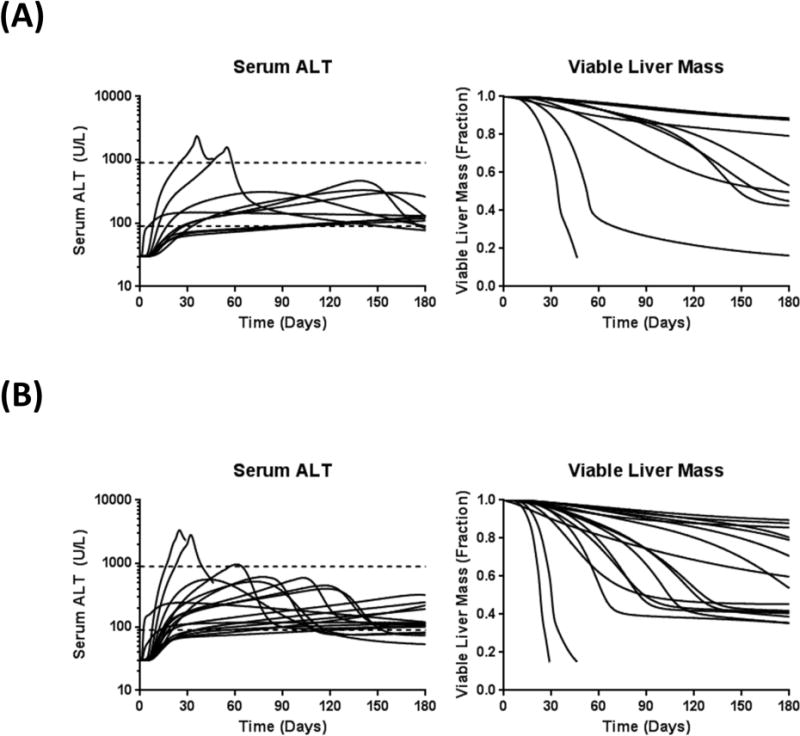
Troglitazone (TGZ) causes delayed, life-threatening drug-induced liver injury in some patients but was not hepatotoxic in rats. This study investigated altered bile acid homeostasis as a mechanism of TGZ hepatotoxicity using a systems pharmacology model incorporating drug/metabolite disposition, bile acid physiology/pathophysiology, hepatocyte life cycle, and liver injury biomarkers. In the simulated human population, TGZ (200-600 mg/day × 6 months) resulted in delayed increases in serum alanine transaminase >3× the upper limit of normal in 0.3-5.1%, with concomitant bilirubin elevations >2× the upper limit of normal in 0.3-3.6%, of the population. By contrast, pioglitazone (15-45 mg/day × 6 months) did not elicit hepatotoxicity, consistent with clinical data. TGZ was not hepatotoxic in the simulated rat population. In summary, mechanistic modeling based only on bile acid effects accurately predicted the incidence, delayed presentation, and species differences in TGZ hepatotoxicity, in addition to predicting the relative liver safety of pioglitazone. Systems pharmacology models integrating physiology and experimental data can evaluate drug-induced liver injury mechanisms and may be useful to predict the hepatotoxic potential of drug candidates.


Conflict of interest statement

Conflict of Interest/Disclosure

The authors declare no conflicts of interest.

Figures

Figure 1
Figure 1. Mechanism of troglitazone (TGZ) hepatotoxicity
Bile acids are taken up into the hepatocytes primarily by sodium-taurocholate cotransporting polypeptide (NTCP) and also by organic anion transporting polypeptides (OATPs). Hepatocellular bile acids are excreted into bile primarily via the bile salt export pump (BSEP). Bile acids also can be transported across the basolateral membrane to sinusoidal blood via basolateral efflux transporters such as multidrug resistance-associated protein (MRP)4, MRP3, and/or organic solute transporter (OST)α/β. TGZ and its major metabolite, TGZ sulfate (TS), are potent inhibitors of hepatic bile acid transporters, which might lead to hepatic bile acid accumulation and subsequent toxicity.
Figure 2
Figure 2. Schematic overview of the bile acid transport inhibition module in DILIsym
Hepatic and systemic disposition of drugs/metabolites are simulated using a physiologically-based pharmacokinetic (PBPK) model (Drug PBPK Model). The Bile Acid Homeostasis Model represents hepatobiliary disposition and enterohepatic recirculation of lithocholic acid (LCA) and chenodeoxycholic acid (CDCA) species, and all other (bulk) bile acids. Using bile acid transport inhibition constants of drugs/metabolites (e.g., Ki, IC50), altered bile acid disposition is simulated. Increased hepatocellular accumulation of bile acids inhibits hepatic ATP synthesis and decreases intracellular ATP concentrations (Cellular ATP Model), leading to necrotic cell death (Hepatocyte Life Cycle Model) and elevations in serum biomarkers of hepatocellular injury and function (e.g., ALT, AST, bilirubin) (Biomarker Model). Loss of hepatocytes will subsequently influence drug and bile acid disposition (dashed lines), allowing dynamic interaction between kinetics and toxicity mechanisms. Details regarding the construction and structures of sub-models can be found in the supplementary materials.
Figure 3
Figure 3. Simulated DILI responses in human and rat virtual populations (SimPops) at specified troglitazone (TGZ) dose levels
Predicted maximum hepatic accumulation of CDCA and LCA species and DILI responses (i.e., minimum hepatic ATP, minimum viable liver mass, maximum serum ALT) post-dose in human SimPops at oral doses of 200 (green triangle), 400 (blue circle), or 600 (red diamond) mg/day TGZ for 6months (A), and rat SimPops at oral doses of 5 (blue circle) or 25 (red diamond) mg/kg/day for 6months (B).
Figure 4
Figure 4. Simulated serum ALT and viable liver mass in susceptible individuals
In human SimPops administered 400 (A) or 600 (B) mg/day troglitazone (TGZ) for 6months, individuals with serum ALT elevations > 3× ULN (n=10 at 400mg/day; n=17 at 600mg/day) are presented. One individual at 400mg/day and two individuals at 600mg/day lost >85% of viable liver mass and was classified as dead.
Figure 5
Figure 5. Sensitivity analysis of transporter inhibition constants
Inhibition constants for BSEP, MRP4, and NTCP were altered 10-fold in either direction of the values measured in isolated transport systems (Supplementary Table S2). Predicted maximum serum ALT concentrations in human and rat SimPops after an oral dose of 600mg/day and 5 mg/kg/day troglitazone (TGZ), respectively, for 1month are presented. Dashed lines represent 3× baseline ALT in human (90 U/L) and rat (63 U/L) SimPops.

Comment in

References

    1. Temple RJ, Himmel MH. Safety of newly approved drugs: implications for prescribing. JAMA. 2002;287:2273–5. - PubMed
    1. Watkins PB, Whitcomb RW. Hepatic dysfunction associated with troglitazone. N Engl J Med. 1998;338:916–7. - PubMed
    1. Presented at the Endocrinologic and Metabolic Drugs Advisory Committee Meeting; 1999. Aprial 26. Available from the US Food and Drug Administration ( http://www.fda.gov/ohrms/dockets/ac/99/transcpt/3499t1a.pdf). Accessed January 25, 2014.
    1. Isley WL. Hepatotoxicity of thiazolidinediones. Expert Opin Drug Saf. 2003;2:581–6. - PubMed
    1. Smith MT. Mechanisms of troglitazone hepatotoxicity. Chem Res Toxicol. 2003;16:679–87. - PubMed

Publication types