

Genomes and transcriptomes of partners in plant-fungal-interactions between canola (Brassica napus) and two Leptosphaeria species
- PMID: 25068644
- PMCID: PMC4113356
- DOI: 10.1371/journal.pone.0103098
Genomes and transcriptomes of partners in plant-fungal-interactions between canola (Brassica napus) and two Leptosphaeria species
Abstract
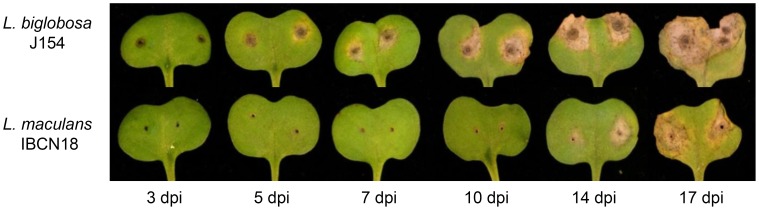
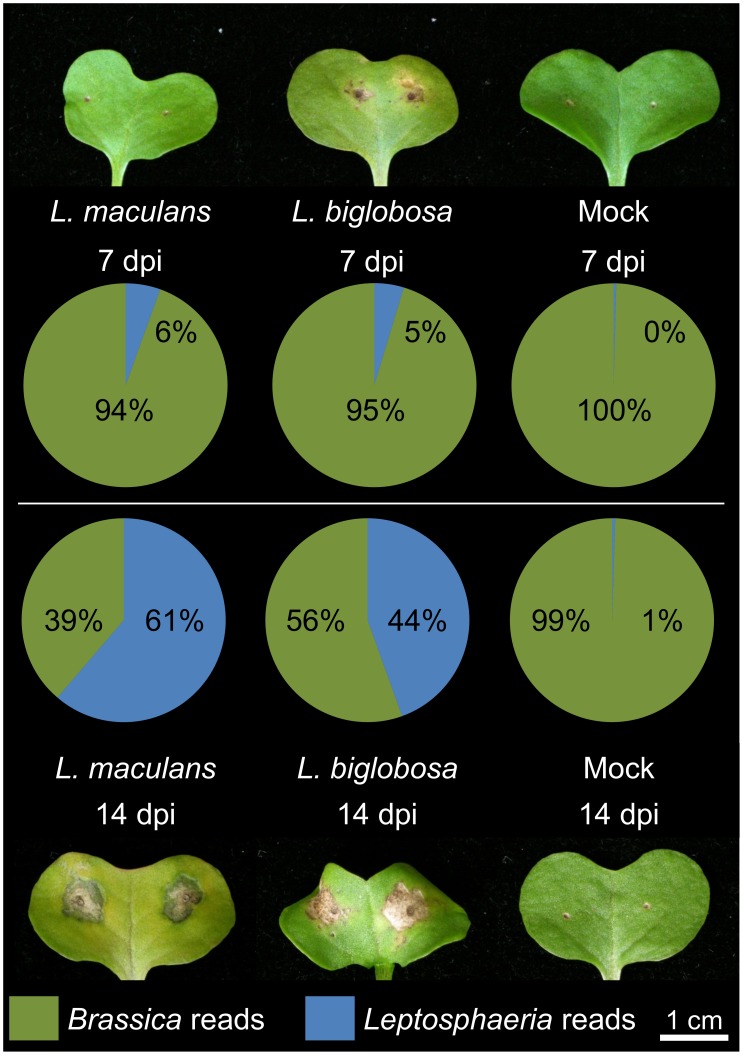
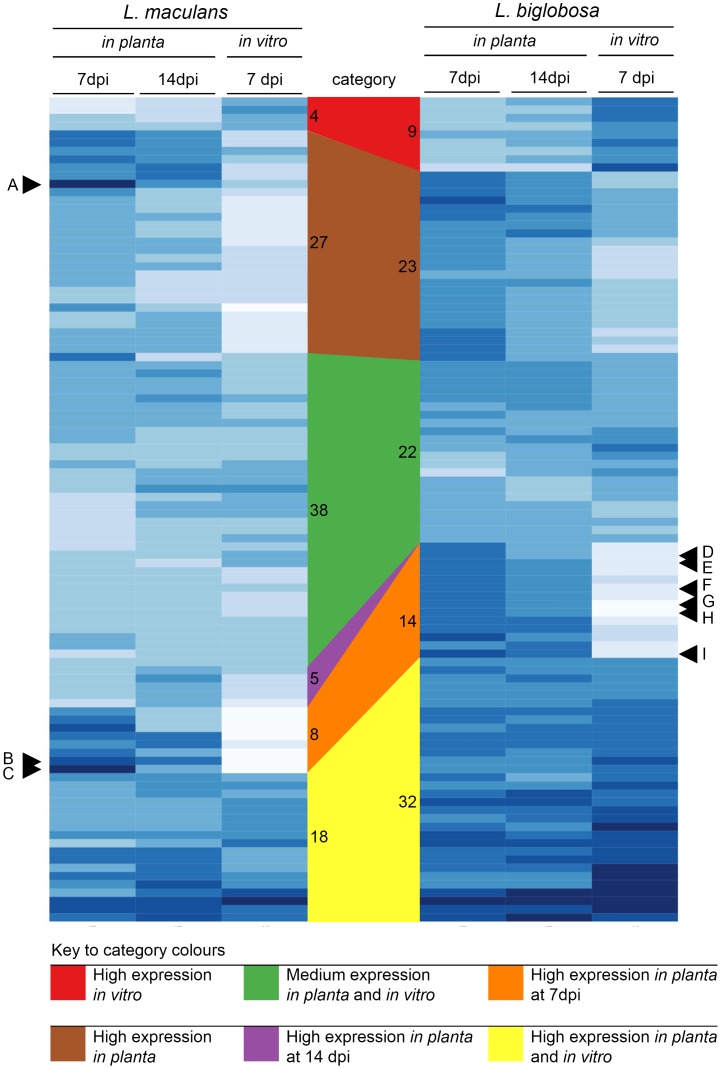
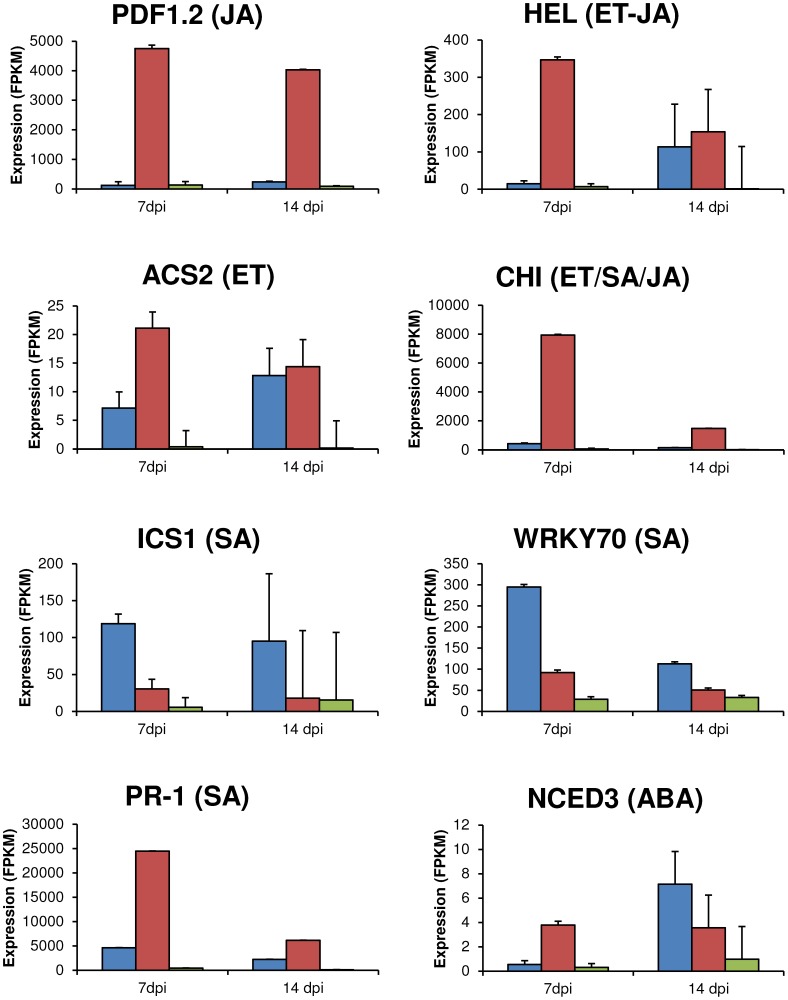
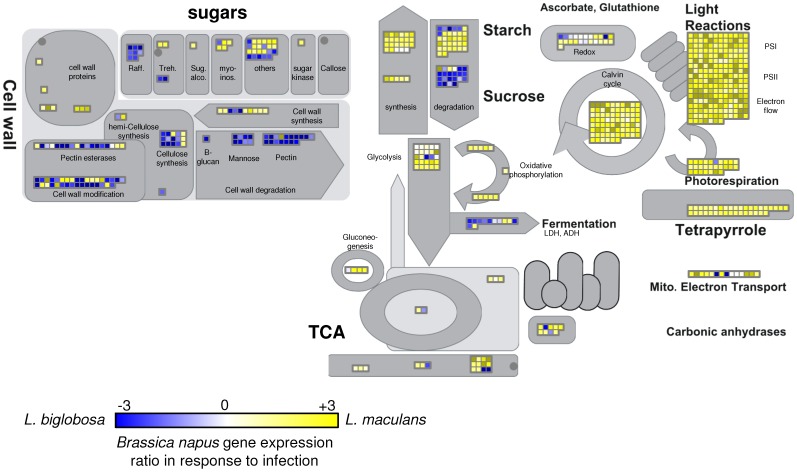
Leptosphaeria maculans 'brassicae' is a damaging fungal pathogen of canola (Brassica napus), causing lesions on cotyledons and leaves, and cankers on the lower stem. A related species, L. biglobosa 'canadensis', colonises cotyledons but causes few stem cankers. We describe the complement of genes encoding carbohydrate-active enzymes (CAZys) and peptidases of these fungi, as well as of four related plant pathogens. We also report dual-organism RNA-seq transcriptomes of these two Leptosphaeria species and B. napus during disease. During the first seven days of infection L. biglobosa 'canadensis', a necrotroph, expressed more cell wall degrading genes than L. maculans 'brassicae', a hemi-biotroph. L. maculans 'brassicae' expressed many genes in the Carbohydrate Binding Module class of CAZy, particularly CBM50 genes, with potential roles in the evasion of basal innate immunity in the host plant. At this time, three avirulence genes were amongst the top 20 most highly upregulated L. maculans 'brassicae' genes in planta. The two fungi had a similar number of peptidase genes, and trypsin was transcribed at high levels by both fungi early in infection. L. biglobosa 'canadensis' infection activated the jasmonic acid and salicylic acid defence pathways in B. napus, consistent with defence against necrotrophs. L. maculans 'brassicae' triggered a high level of expression of isochorismate synthase 1, a reporter for salicylic acid signalling. L. biglobosa 'canadensis' infection triggered coordinated shutdown of photosynthesis genes, and a concomitant increase in transcription of cell wall remodelling genes of the host plant. Expression of particular classes of CAZy genes and the triggering of host defence and particular metabolic pathways are consistent with the necrotrophic lifestyle of L. biglobosa 'canadensis', and the hemibiotrophic life style of L. maculans 'brassicae'.
Conflict of interest statement
Figures
Similar articles
-
Molecular phylogeny of the Leptosphaeria maculans-L. biglobosa species complex.Mycol Res. 2003 Nov;107(Pt 11):1287-304. doi: 10.1017/s0953756203008554. Mycol Res. 2003. PMID: 15000231
-
Genome-wide transcriptomic analyses provide insights into the lifestyle transition and effector repertoire of Leptosphaeria maculans during the colonization of Brassica napus seedlings.Mol Plant Pathol. 2016 Oct;17(8):1196-210. doi: 10.1111/mpp.12356. Epub 2016 May 3. Mol Plant Pathol. 2016. PMID: 26679637 Free PMC article.
-
Less Virulent Leptosphaeria biglobosa Immunizes the Canola Plant to Resist Highly Virulent L. maculans, the Blackleg Pathogen.Plants (Basel). 2022 Apr 6;11(7):996. doi: 10.3390/plants11070996. Plants (Basel). 2022. PMID: 35406977 Free PMC article.
-
Recent Findings Unravel Genes and Genetic Factors Underlying Leptosphaeria maculans Resistance in Brassica napus and Its Relatives.Int J Mol Sci. 2020 Dec 30;22(1):313. doi: 10.3390/ijms22010313. Int J Mol Sci. 2020. PMID: 33396785 Free PMC article. Review.
-
Molecular Interactions Between Leptosphaeria maculans and Brassica Species.Annu Rev Phytopathol. 2022 Aug 26;60:237-257. doi: 10.1146/annurev-phyto-021621-120602. Epub 2022 May 16. Annu Rev Phytopathol. 2022. PMID: 35576591 Review.
Cited by
-
Transcriptome Analysis of Plenodomus tracheiphilus Infecting Rough Lemon (Citrus jambhiri Lush.) Indicates a Multifaceted Strategy during Host Pathogenesis.Biology (Basel). 2022 May 17;11(5):761. doi: 10.3390/biology11050761. Biology (Basel). 2022. PMID: 35625489 Free PMC article.
-
A New Subclade of Leptosphaeria biglobosa Identified from Brassica rapa.Int J Mol Sci. 2019 Apr 3;20(7):1668. doi: 10.3390/ijms20071668. Int J Mol Sci. 2019. PMID: 30987176 Free PMC article.
-
Spontaneous and CRISPR/Cas9-induced mutation of the osmosensor histidine kinase of the canola pathogen Leptosphaeria maculans.Fungal Biol Biotechnol. 2017 Dec 16;4:12. doi: 10.1186/s40694-017-0043-0. eCollection 2017. Fungal Biol Biotechnol. 2017. PMID: 29270298 Free PMC article.
-
Population Genomics analysis of Leptosphaeria biglobosa Associated with Brassica napus in China Reveals That Geographical Distribution Influences Its Genetic Polymorphism.Microorganisms. 2024 Jul 1;12(7):1347. doi: 10.3390/microorganisms12071347. Microorganisms. 2024. PMID: 39065115 Free PMC article.
-
Constitutive expression of transcription factor SirZ blocks pathogenicity in Leptosphaeria maculans independently of sirodesmin production.PLoS One. 2021 Jun 10;16(6):e0252333. doi: 10.1371/journal.pone.0252333. eCollection 2021. PLoS One. 2021. PMID: 34111151 Free PMC article.
References
-
- Oliver RP, Solomon PS (2010) New developments in pathogenicity and virulence of necrotrophs. Curr Opin Plant Biol 13: 415–419. - PubMed
-
- Shoemaker RA, Brun H (2001) The teleomorph of the weakly aggressive segregate of Leptosphaeria maculans . Can J Bot 79: 412–419.
-
- Voigt K, Cozijnsen AJ, Kroymann J, Pöggeler S, Howlett BJ (2005) Phylogenetic relationships between members of the crucifer pathogenic Leptosphaeria maculans species complex as shown by mating type (MAT1-2), actin, and β-tubulin sequences. Mol Phylogenet Evol 37: 541–557. - PubMed
Publication types
MeSH terms
Substances
LinkOut - more resources
Full Text Sources
Other Literature Sources
