. 2014 Jul 28:4:5848.
doi: 10.1038/srep05848.

Antarctic-wide array of high-resolution ice core records reveals pervasive lead pollution began in 1889 and persists today

Affiliations

Antarctic-wide array of high-resolution ice core records reveals pervasive lead pollution began in 1889 and persists today

J R McConnell et al. Sci Rep. .

Abstract

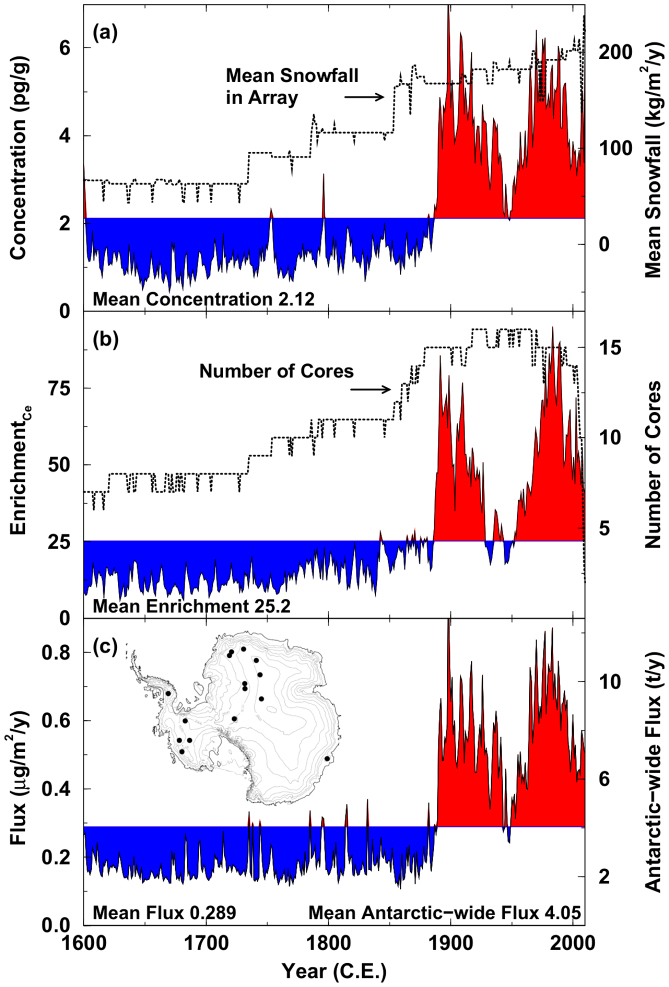
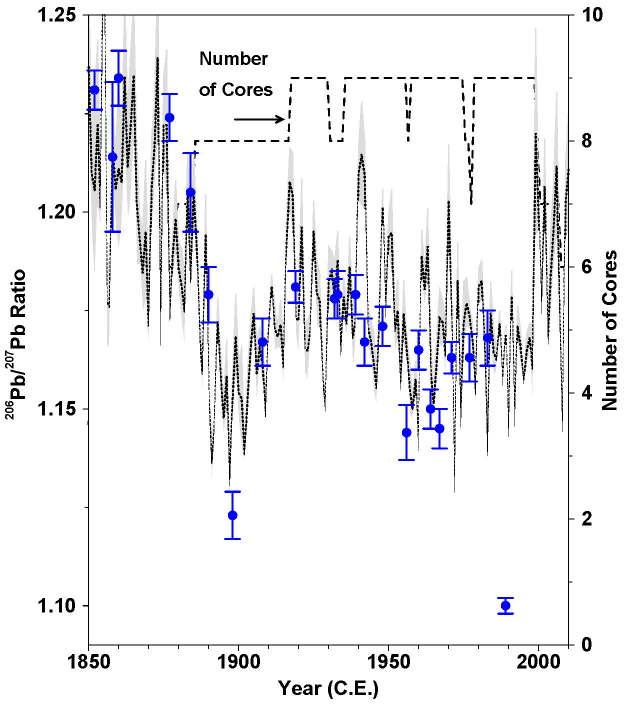
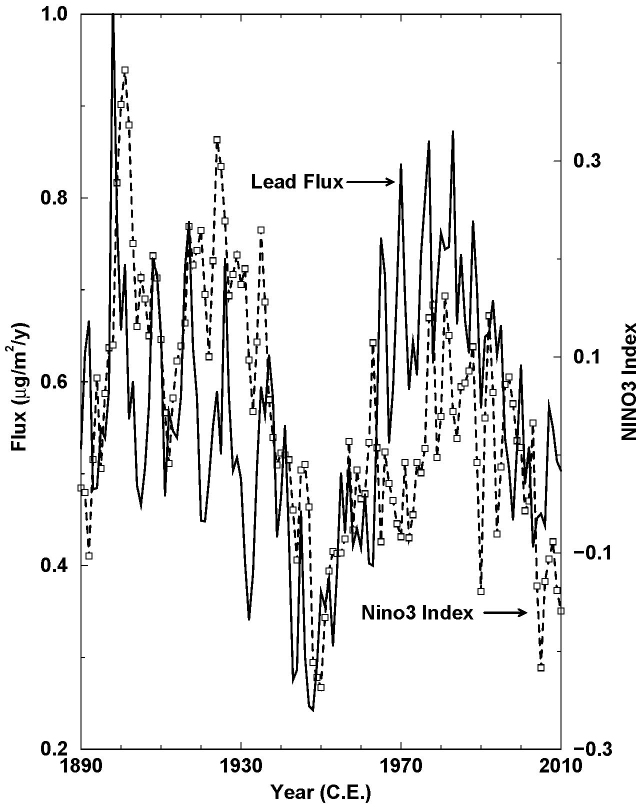
Interior Antarctica is among the most remote places on Earth and was thought to be beyond the reach of human impacts when Amundsen and Scott raced to the South Pole in 1911. Here we show detailed measurements from an extensive array of 16 ice cores quantifying substantial toxic heavy metal lead pollution at South Pole and throughout Antarctica by 1889 - beating polar explorers by more than 22 years. Unlike the Arctic where lead pollution peaked in the 1970s, lead pollution in Antarctica was as high in the early 20(th) century as at any time since industrialization. The similar timing and magnitude of changes in lead deposition across Antarctica, as well as the characteristic isotopic signature of Broken Hill lead found throughout the continent, suggest that this single emission source in southern Australia was responsible for the introduction of lead pollution into Antarctica at the end of the 19(th) century and remains a significant source today. An estimated 660 t of industrial lead have been deposited over Antarctica during the past 130 years as a result of mid-latitude industrial emissions, with regional-to-global scale circulation likely modulating aerosol concentrations. Despite abatement efforts, significant lead pollution in Antarctica persists into the 21(st) century.


Conflict of interest statement

The authors declare no competing financial interests.

Figures

Figure 1
Figure 1. Composite ice core records of lead in Antarctica from 1600 to 2010 C.E. Records are in annual resolution.
Areas shaded in blue and red indicate time periods where the lead value is below or above the 1600 to 2010 mean, respectively, highlighting the marked changes before and after industrialization in the mid- and low-latitudes. (a) Lead concentration and the mean snowfall each year for the composite record. (b) Enrichment of lead relative to the dust proxy cerium and number of cores included in the composites each year. (c) Lead flux measured in the array after adjustment to account for site-specific differences in annual snowfall (left axis) and estimated Antarctic-wide flux (right axis). Integration of the red area indicates that ~610 t of industrial lead have been deposited in Antarctica during the past 130 years. Inset map shows the locations of the ice cores used in this study. Inset map was generated using Panoply Data Viewer software; Schmunk, Robert B. (2014). Panoply Data Viewer (version 4.0.1) [Software]. Available from http://www.giss.nasa.gov/tools/panoply/.
Figure 2
Figure 2. Composite record of semi-quantitative 206Pb/207Pb isotopic ratios from this study (geometric average) compared with previously measured values from Law Dome (blue, error bar indicates standard error).
We consider the measurements semi-quantitative because no calibration specific for lead isotopic ratios was made during our continuous measurements. Grey shading indicates the standard error in the composite mean values. The number of ice cores included in the composite incorporates measurements from two coastal and seven inland sites spanning both East and West Antarctica. Temporal evolution of the Antarctic-wide isotopic composite record also is consistent with discrete measurements from the previously studied coastal sites (see also Supplementary Fig. 6 online), with only small differences in magnitude during the late 19th and early 20th centuries.
Figure 3
Figure 3. Comparison between 21-year running means of the composite lead flux from the eight ice cores individually dated using annual layer counting; Supplementary Fig. 8a) and a reconstruction of the ENSO Index (NINO3).
Similarities between multi-decadal ENSO variability and lead flux during the industrial era (post-1890) indicate that changes in long-range transport in addition to emissions may contribute to the observed variations in lead deposition over Antarctica.

References

    1. McConnell J. R., Lamorey G. W. & Hutterli M. A. A 250-year high-resolution record of Pb flux and crustal enrichment in central Greenland. Geophys. Res. Lett. 29, 2130 10.1029/2002gl016016 (2002). - DOI
    1. McConnell J. R. & Edwards R. Coal burning leaves toxic heavy metal legacy in the Arctic. P. Natl. Acad. Sci. USA 105, 12140–12144, 10.1073/pnas.0803564105 (2008). - DOI - PMC - PubMed
    1. Sangster D. F., Outridge P. M. & Davis W. J. Stable lead isotope characteristics of lead ore deposits of environmental significance. Environ. Rev. 8, 115–147, 10.1139/a00-008 (2000). - DOI
    1. Rosman K. J. R., Chisholm W., Hong S. M., Candelone J. P. & Boutron C. F. Lead from Carthaginian and Roman Spanish mines isotopically identified in Greenland ice dated from 600 BC to 300 AD. Environ. Sci. Technol. 31, 3413–3416, 10.1021/es970038k (1997). - DOI
    1. Rosman K. J. R., Chisholm W., Boutron C. F., Candelone J. P. & Gorlach U. Isotopic evidence for the source of lead in Greenland snows since the late 1960s. Nature 362, 333–335, 10.1038/362333a0 (1993). - DOI - PubMed

Publication types