. 2014 Dec;32(12):1157-70.
doi: 10.1007/s40273-014-0193-3.

A guide to handling missing data in cost-effectiveness analysis conducted within randomised controlled trials

Affiliations

A guide to handling missing data in cost-effectiveness analysis conducted within randomised controlled trials

Rita Faria et al. Pharmacoeconomics. 2014 Dec.

Abstract

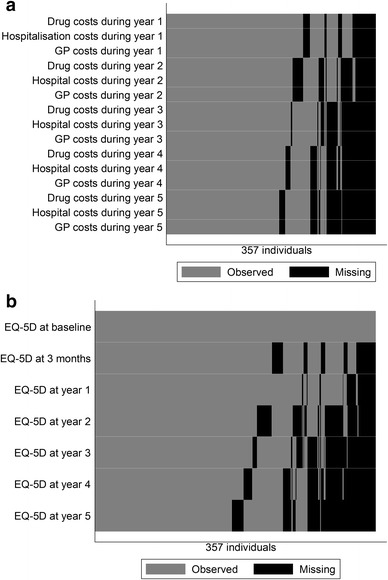
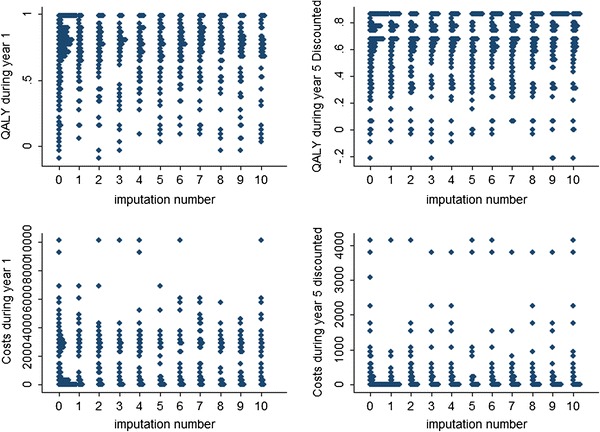
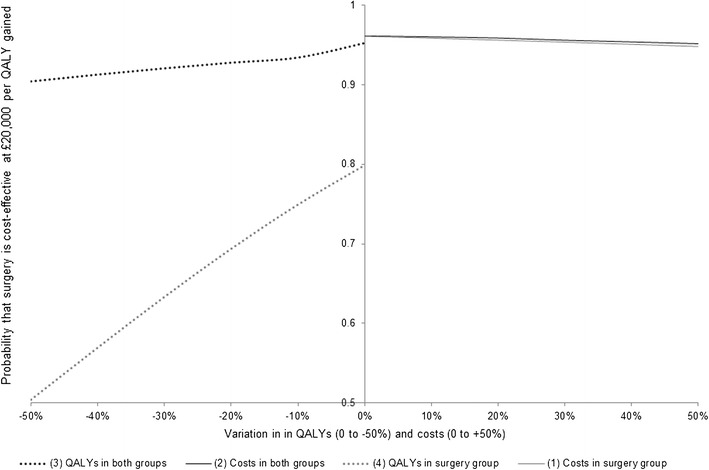
Missing data are a frequent problem in cost-effectiveness analysis (CEA) within a randomised controlled trial. Inappropriate methods to handle missing data can lead to misleading results and ultimately can affect the decision of whether an intervention is good value for money. This article provides practical guidance on how to handle missing data in within-trial CEAs following a principled approach: (i) the analysis should be based on a plausible assumption for the missing data mechanism, i.e. whether the probability that data are missing is independent of or dependent on the observed and/or unobserved values; (ii) the method chosen for the base-case should fit with the assumed mechanism; and (iii) sensitivity analysis should be conducted to explore to what extent the results change with the assumption made. This approach is implemented in three stages, which are described in detail: (1) descriptive analysis to inform the assumption on the missing data mechanism; (2) how to choose between alternative methods given their underlying assumptions; and (3) methods for sensitivity analysis. The case study illustrates how to apply this approach in practice, including software code. The article concludes with recommendations for practice and suggestions for future research.


Figures

Fig. 1
Fig. 1
Pattern of missing data. Black shading represents missing data for one or more individuals (arrayed along the horizontal axis) on a particular variable (arrayed along the vertical axis); grey shading represents observed data. a Pattern of missing data on costs. b Pattern of missing data on health-related quality of life (EQ-5D). GP general practitioner
Fig. 2
Fig. 2
Comparison of the distribution of imputed values (imputation number 1 to 10) with the observed data (imputation number 0) for quality-adjusted life-years and costs in years 1 and 5. Individual values are represented by dots; the width of a row of dots represents the frequency of values in the distribution. QALYs quality-adjusted life-years
Fig. 3
Fig. 3
Sensitivity analysis: data are missing not at random for QALYs or for costs. Note—imputed costs between year 2 and 5 are increased by 10 %; imputed QALYs between year 2 and 5 are reduced by 10 %. The probability that surgery is cost effective is stable at values close to 1 even if the imputed costs are increased only for the individuals with missing data randomised to the surgery group. Changes in imputed QALYs have an impact on the probability of cost effectiveness if the shift is implemented only in patients with missing data randomised to the surgery group but probability remains above 50 % throughout all scenarios. QALY quality-adjusted life-year

References

    1. Panel on Handling Missing Data in Clinical Trials; National Research Council . The prevention and treatment of missing data in clinical trials. Washington, DC: The National Academies Press; 2010. - PubMed
    1. Manca A, Palmer S. Handling missing data in patient-level cost-effectiveness analysis alongside randomised clinical trials. Appl Health Econ Health Policy. 2005;4(2):65–75. doi: 10.2165/00148365-200504020-00001. - DOI - PubMed
    1. Oostenbrink JB, Al MJ. The analysis of incomplete cost data due to dropout. Health Econ. 2005;14(8):763–776. doi: 10.1002/hec.966. - DOI - PubMed
    1. Briggs A, Clark T, Wolstenholme J, Clarke P. Missing…. presumed at random: cost-analysis of incomplete data. Health Econ. 2003;12(5):377–392. doi: 10.1002/hec.766. - DOI - PubMed
    1. Blough DK, Ramsey S, Sullivan SD, Yusen R. The impact of using different imputation methods for missing quality of life scores on the estimation of the cost-effectiveness of lung-volume-reduction surgery. Health Econ. 2009;18(1):91–101. doi: 10.1002/hec.1347. - DOI - PubMed

Publication types

MeSH terms