. 2014 Dec;8(8):1703-18.
doi: 10.1016/j.molonc.2014.07.004. Epub 2014 Jul 12.

Screening and identification of small molecule inhibitors of ErbB2-induced invasion

Affiliations

Screening and identification of small molecule inhibitors of ErbB2-induced invasion

D M Brix et al. Mol Oncol. 2014 Dec.

Abstract

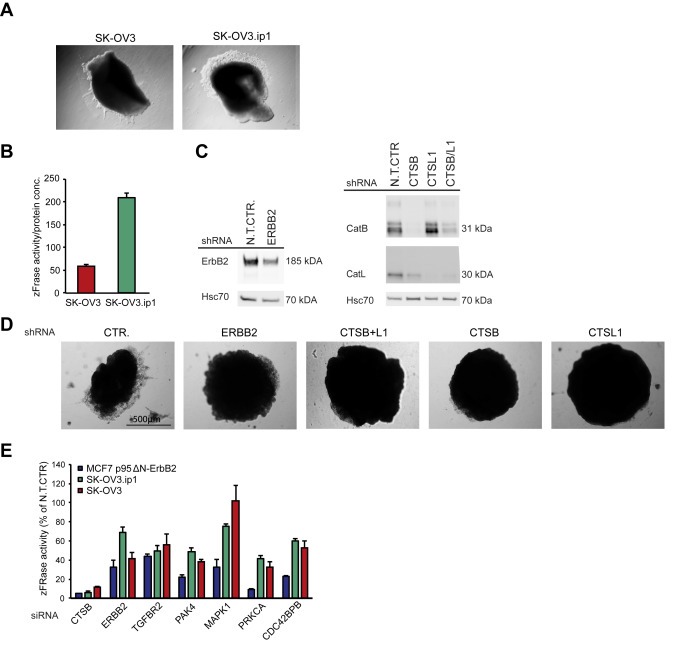
ERBB2 amplification and overexpression are strongly associated with invasive cancer with high recurrence and poor prognosis. Enhanced ErbB2 signaling induces cysteine cathepsin B and L expression leading to their higher proteolytic activity (zFRase activity), which is crucial for the invasion of ErbB2-positive breast cancer cells in vitro. Here we introduce a simple screening system based on zFRase activity as a primary readout and a following robust invasion assay and lysosomal distribution analysis for the identification of compounds that can inhibit ErbB2-induced invasion. With an unbiased kinase inhibitor screen, we identified Bohemine/Roscovitine, Gö6979 and JAK3 inhibitor VI as compounds that can efficiently decrease cysteine cathepsin activity. Using the well-established and clinically relevant ErbB1 and ErbB2 inhibitor lapatinib as a positive control, we studied their ability to inhibit ErbB2-induced invasion in 3-dimensional Matrigel cultures. We found one of them, JAK3 inhibitor VI, capable of inhibiting invasion of highly invasive ErbB2-positive ovarian cancer cells as efficiently as lapatinib, whereas Gö6979 and Roscovitine displayed more modest inhibition. All compounds reversed the malignant, ErbB2-induced and invasion-supporting peripheral distribution of lysosomes. This effect was most evident for lapatinib and JAK3 inhibitor VI and milder for Gö6979 and Roscovitine. Our results further showed that JAK3 inhibitor VI function was independent of JAK kinases but involved downregulation of cathepsin L. We postulate that the screening method and the verification experiments that are based on oncogene-induced changes in lysosomal hydrolase activity and lysosomal distribution could be used for identification of novel inhibitors of ErbB2-induced invasiveness. Additionally, we introduce a novel function for lapatinib in controlling malignant lysosomal distribution, that may also be involved in its capability to inhibit ErbB2-induced invasion in vivo.

Keywords: JAK3 inhibitor VI; Lapatinib; Lysosome; Ovarian cancer; Three-dimensional invasion assay; cathepsin L.


Figures

Figure 1
Figure 1
A pharmacological kinase inhibitor screen identified compounds that decrease cysteine cathepsin activity. (A) Inhibitor screen. MCF7 p95ΔN‐ErbB2 cells were seeded in 96‐well plates 24 h prior inhibitor‐treatment. Cells were treated with 1 μM kinase inhibitor from Inhibitor Select Libraries I (dark blue and red) and II (light blue and orange) (Calbiochem) for 24 h. DMSO was used as a vehicle control. zFRase activity was normalized to protein concentration. Best screening hits from the inhibitor Select Libraries I and II are marked with red and orange, respectively. Mean ± Stdev are based on three independent screens. (B) zFRase activity and lactate dehydrogenase (LDH) activity measurements for p95ΔN‐ErbB2 MCF7cells. Cells were treated with 1 μM of the indicated kinase inhibitors collected from the Inhibitor Select Libraries I and II (Calbiochem) for 24 h. DMSO was used as a vehicle control. zFRase activity and LDH activity was normalized to protein concentration. Mean ± Stdev for zFRase activity are based on three independent experiments. Mean ± Stdev for LDH activity represent standard deviation from the mean of triplicates from one experiment. (C) zFRase activity measurement of MCF7 p95ΔN‐ErbB2 cells treated with 1 μM or 10 μM Roscovitine for 24 h zFRase activity was normalized to protein concentration. Data are representative of three independent assays. Mean ± Stdev represent standard deviation from the mean of triplicates from one experiment.
Figure 2
Figure 2
ErbB2 drives invasiveness of ErbB2‐positive ovarian cancer cell lines via a signaling network similar to that in ErbB2‐positive breast cancer cells. (A) 3D Matrigel invasion assay. SK‐OV3 and SK‐OV3.ip1 cells were grown in hanging drops overnight to establish multicellular spheroids. Cell spheroids were grown inside thin‐layered Matrigel clumps for up to 72 h and visualized with Olympus 1×71 light microscope for detection of invading growth. Images are taken with 10× magnification. Images shown are representative of each cell line. (B) zFRase activity measurement for SK‐OV3 and SK‐OV3.ip1 cells. zFRase activity was normalized to protein concentration. Data are representative of three independent experiments. Mean ± Stdev represent standard deviation from the mean of triplicates from one experiment. (C) Immunoblot analysis for the detection of ErbB2, cathepsin B and cathepsin L in SK‐OV3.ip1 cells stably depleted of ErbB2, cathepsin B, cathepsin L and cathpsin B + L using shRNAs. Hsc70 was used to control equal loading. (D) 3D Matrigel invasion assay. SK‐OV3.ip1 control cells and SK‐OV3.ip1 cells stably depleted of ErbB2, cathepsin B, cathepsin L and cathepsin B + L were grown in hanging drops overnight to establish multicellular spheroids. Cell spheroids were grown inside thin‐layered Matrigel clumps for up to 72 h and visualized with Olympus 1×71 light microscope for detection of invading growth. Images are taken with 10× magnification. The scale bar represents 500 μm. Images shown are representative of the indicated cell line. (E) zFRase activity of p95ΔN‐ErbB2 MCF7, SK‐OV3.ip1 and SK‐OV3 cells treated with 60 nM of the indicated siRNAs for 72 h zFRase activity was normalized to total protein concentration and is presented as the percentage of the activity in cells transfected with a non‐targeted control siRNA (N.T.CTR.). Data are representative of three independent experiments. Mean ± Stdev represent standard deviation from the mean of triplicates from one experiment.
Figure 3
Figure 3
Lapatinib and JAK3 inhibitor VI completely inhibit cell invasion. (A) 3D Matrigel invasion assay. SK‐OV3.ip1 cells were grown in hanging drops overnight to establish multicellular spheroids. Cell spheroids were grown inside thin‐layered Matrigel clumps for 24 h after treatment with 10 μM final concentration of the indicated inhibitors. After 24 and 48 h the spheroids were visualized with Olympus 1×71 light microscope to detect invading growth. Images are taken with 6,4× magnification and the scale bar represents 800 μm. Images shown are representative of each treatment. (B) Quantification of invasive growth. (C) Hematoxylin‐eosin and proliferating cell nuclear antigen (PCNA) antibody staining of sections made from the samples of (3A). Matrigel‐embedded cell spheroids were fixed in paraffin and sections were prepared. Sections for each treatment were either subjected to hematoxylin‐eosin (top) staining or stained for PCNA (bottom). Images are taken with 40× magnification and are representative of each treatment.
Figure 4
Figure 4
Lapatinib and JAK3 inhibitor VI treatments change lysosomal distribution from the cell periphery to the perinuclear area. (A) Confocal immunofluorescence images for the detection of lysosomal membrane protein 2 (LAMP‐2) for lysosome localization. SK‐OV3.ip1 cells were treated with 10 μM of the indicated inhibitors for 24 h after which they were fixed and stained for the detection of the lysosomal membrane protein LAMP‐2 (green), alpha tubulin (red) and nucleus (blue). Images shown are representative of each treatment from three independent experiments. (B) Quantification of predominant lysosomal distribution from cells on images in (4A).
Figure 5
Figure 5
JAK3 inhibitor VI treatment inhibits invasion of ErbB2‐positive cells with a mechanism that is independent of JAKs but involves ErbB2 and CTSL1 downregulation. (A) Confocal immunofluorescence images for the detection of LAMP‐2 localization. SK‐OV3.ip1 cells were treated with 25 nM of the indicated siRNAs for 96 h after which they were fixed and stained for the detection of the lysosomal membrane protein LAMP‐2 (green), alpha tubulin (red) and nucleus (blue). Images shown are representative of each treatment from three independent experiments. (B) zFRase activity of SK‐OV3.ip1 cells treated with 25 nM of the indicated siRNAs for 96 h zFRase activity was normalized to total protein concentration and is presented as the percentage of the activity in cells transfected with a non‐targeted control siRNA (N.T.CTR.). Mean ± Stdev represent standard deviation from the mean of three independent experiments. (C) Immunoblot analysis of inhibitor treated cells. SK‐OV3.ip1 cells were treated with 10 μM of the indicated inhibitors for 24 h. STAT3 was used to control the phosphor‐STAT3 blot and GAPDH was used to control equal loading. The blots shown are representatives of more than three independent experiments. (D) Confocal immunofluorescence images for the detection of LAMP‐2 lysosome localization. SK‐OV3.ip1 cells were treated with 10 μM of the indicated inhibitors for 24 h after which they were fixed and stained for the detection of the lysosomal membrane protein LAMP‐2 (green), alpha tubulin (red) and nucleus (blue). Images shown are representative of each treatment from three independent experiments. (E) Immunoblot analysis of inhibitor treated cells. SK‐OV3.ip1 cells were treated with 10 μM of indicated inhibitors for 24 h ErbB2 was used to control the phosphor‐ErbB2 blot and GAPDH was used to control equal loading. The blots shown are representative of three independent experiments. (F) Quantitative RT PCR analysis for the detection of CTSL1 and CTSB expression in SK‐OV3.ip1 cells treated with 10 μM of the indicated inhibitors for 24 h. The mRNA expression was normalized to the expression of PPIB. Mean ± Stdev represent standard deviation from the mean of three or more independent experiments.
Figure 5
Figure 5
(continued)

References

    1. Adams, C. , Aldous, D.J. , Amendola, S. , Bamborough, P. , Bright, C. , Crowe, S. , Eastwood, P. , Fenton, G. , Foster, M. , Harrison, T.K. , King, S. , Lai, J. , Lawrence, C. , Letallec, J.P. , McCarthy, C. , Moorcroft, N. , Page, K. , Rao, S. , Redford, J. , Sadiq, S. , Smith, K. , Souness, J.E. , Thurairatnam, S. , Vine, M. , Wyman, B. , 2003. Mapping the kinase domain of Janus Kinase 3. Bioorg. Med. Chem. Lett. 13, 3105–3110. - PubMed
    1. Anastassiadis, T. , Deacon, S.W. , Devarajan, K. , Ma, H. , Peterson, J.R. , 2011. Comprehensive assay of kinase catalytic activity reveals features of kinase inhibitor selectivity. Nat. Biotechnol. 29, 1039–1045. - PMC - PubMed
    1. Arribas, J. , Baselga, J. , Pedersen, K. , Parra-Palau, J.L. , 2011. p95HER2 and breast cancer. Cancer Res. 71, 1515–1519. - PubMed
    1. Bain, J. , Plater, L. , Elliott, M. , Shpiro, N. , Hastie, C.J. , McLauchlan, H. , Klevernic, I. , Arthur, J.S. , Alessi, D.R. , Cohen, P. , 2007. The selectivity of protein kinase inhibitors: a further update. Biochem. J. 408, 297–315. - PMC - PubMed
    1. Baselga, J. , Swain, S.M. , 2009. Novel anticancer targets: revisiting ERBB2 and discovering ERBB3. Nat. Rev. Cancer 9, 463–475. - PubMed

Publication types