. 2014 Jul 28;15(1):631.
doi: 10.1186/1471-2164-15-631.

Analysis of stranded information using an automated procedure for strand specific RNA sequencing

Affiliations

Analysis of stranded information using an automated procedure for strand specific RNA sequencing

Benjamín Sigurgeirsson et al. BMC Genomics. .

Abstract

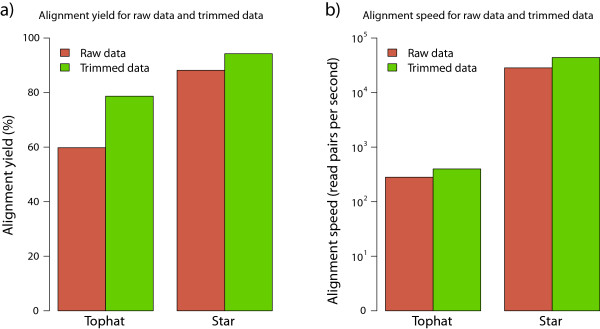
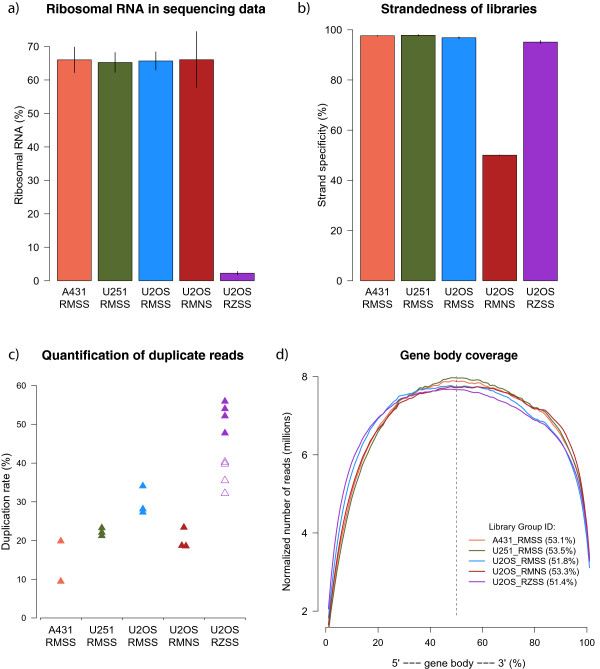
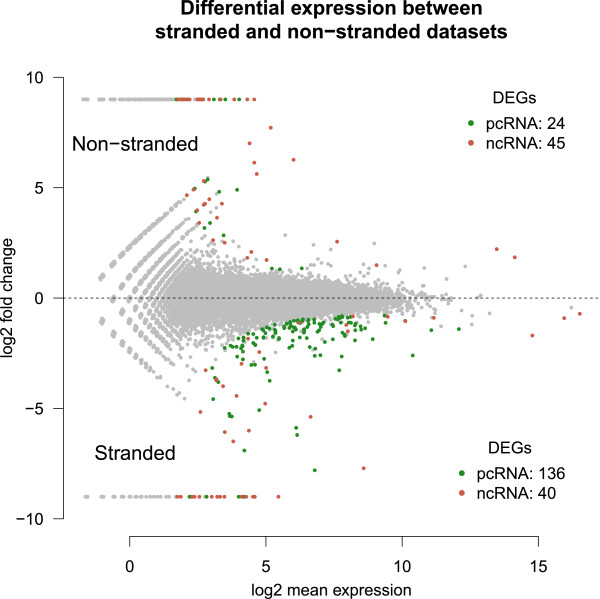
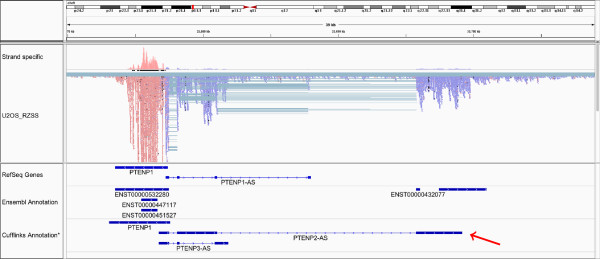
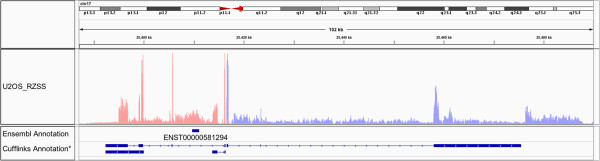
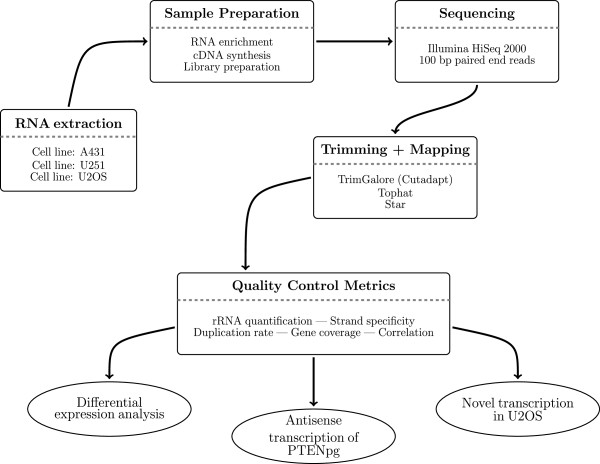
Background: Strand specific RNA sequencing is rapidly replacing conventional cDNA sequencing as an approach for assessing information about the transcriptome. Alongside improved laboratory protocols the development of bioinformatical tools is steadily progressing. In the current procedure the Illumina TruSeq library preparation kit is used, along with additional reagents, to make stranded libraries in an automated fashion which are then sequenced on Illumina HiSeq 2000. By the use of freely available bioinformatical tools we show, through quality metrics, that the protocol is robust and reproducible. We further highlight the practicality of strand specific libraries by comparing expression of strand specific libraries to non-stranded libraries, by looking at known antisense transcription of pseudogenes and by identifying novel transcription. Furthermore, two ribosomal depletion kits, RiboMinus and RiboZero, are compared and two sequence aligners, Tophat2 and STAR, are also compared.

Results: The, non-stranded, Illumina TruSeq kit can be adapted to generate strand specific libraries and can be used to access detailed information on the transcriptome. The RiboZero kit is very effective in removing ribosomal RNA from total RNA and the STAR aligner produces high mapping yield in a short time. Strand specific data gives more detailed and correct results than does non-stranded data as we show when estimating expression values and in assembling transcripts. Even well annotated genomes need improvements and corrections which can be achieved using strand specific data.

Conclusions: Researchers in the field should strive to use strand specific data; it allows for more confidence in the data analysis and is less likely to lead to false conclusions. If faced with analysing non-stranded data, researchers should be well aware of the caveats of that approach.


Figures

Figure 1
Figure 1
Alignment yield and mapping speed. Mapping yield a) and mapping speed b) for the aligners Tophat and Star, performed both on raw data and quality data. The mapping efficiancy and mapping speed improves using the quality data for both aligners. Star outperforms Tophat both in alignment yield and in mapping speed. Note that the alignment speed is plotted on a log scale.
Figure 2
Figure 2
Quality control metrics for human cell line libraries. a) rRNA content in libraries treated with RiboZero is 2.24% on average while rRNA content in libraries treated with RiboMinus is 65.7% on average. Error bars denote standard error. b) The strand specificty of strand specific libraries is 96.6% on average; the libraries treated with RiboMinus have slightly higher strand specificity than the libraries treated with RiboZero. The unstranded libraries have strand specificity of 50.0%. c) The duplication rate varies between the libraries. The higher duplication rate of the libraries treated with RiboZero compared to the libraries treated with RiboMinus can partly be explained by the much higher sequencing depth of those libraries. The hollow triangles represent the duplication rate of the downsampled data (see text for details). d) All libraries show even gene coverage. The percentages in parenthesis is the percentage of reads that map closer to the 3’ end than to the 5’ end. [RM = RiboMinus, RZ = RiboZero, SS = strand specific, NS = non-stranded].
Figure 3
Figure 3
Differential expression profile when comparing the strand specific libraries to the non-stranded libraries. All green dots are protein coding genes found to be signficantly differentially expressed and all red dots are non coding genes found to be signficantly differentially expressed. pcRNA: protein coding RNA, ncRNA: non-coding RNA.
Figure 4
Figure 4
Antisense RNA of PTENP1. Antisense transcription of the pseudogene PTENP1. The RefSeq annotation includes only one isoform (top annotation track) while the Ensembl annotation does not have this transcript annotated. Our data, based on Cufflinks assembly, suggest two alternative isoforms for this transcript labeled PTENP1-AS2 and PTENP1-AS3. The PTENP1-AS2 isoform includes a novel exon, higlighted by a red arrow, which overlaps ensembl annotation of other genes. It is suggested here that this ensembl annotation is wrong and that these genes are part of the PTENP1-AS gene. *The Cufflinks assembly shown here has been cleaned up a bit. For the direct output delivered by Cufflinks see Additional file 12.
Figure 5
Figure 5
Novel expression in U2OS. Novel, cell specific, expression on chromosome 17. The coverage plot shows transcriptional activity, color coded to reflect the strand of origin. In the Ensembl database this region has one annotated pseudogene. The data here indicate high transcriptional activity from both strands. Shown at the bottom is the annotation as suggested by Cufflinks. *The Cufflinks assembly shown here has been cleaned up a bit. For the direct output delivered by Cufflinks see Additional file 13.
Figure 6
Figure 6
Flowchart giving an overview of the experimental design.

References

    1. Prediger E. Quantitating mrnas with relative and competitive rt-pcr. In: Schein C, Schein C, editors. Nuclease Methods and Protocols. New York: Humana Press; 2001. pp. 49–63. - PubMed
    1. Van der Auwera I, Van Laere SJ, Van den Eynden GG, Benoy I, van Dam P, Colpaert CG, Fox SB, Turley H, Harris AL, Van Marck EA, Vermeulen PB, Dirix LY. Increased angiogenesis and lymphangiogenesis in inflammatory versus noninflammatory breast cancer by real-time reverse transcriptase-pcr gene expression quantification. Clin Cancer Res. 2004;10(23):7965–7971. doi: 10.1158/1078-0432.CCR-04-0063. - DOI - PubMed
    1. Schena M, Shalon D, Davis RW, Brown PO. Quantitative monitoring of gene expression patterns with a complementary dna microarray. Science. 1995;270(5235):467–470. doi: 10.1126/science.270.5235.467. - DOI - PubMed
    1. DeRisi J, Penland L, Brown PO, Bittner ML, Meltzer PS, Ray M, Chen Y, Su YA, Trent JM. Use of a cdna microarray to analyse gene expression patterns in human cancer. Nat Genet. 1996;14(4):457–460. doi: 10.1038/ng1296-457. - DOI - PubMed
    1. Okubo K, Hori N, Matoba R, Niiyama T, Fukushima A, Kojima Y, Matsubara K. Large scale cDNA sequencing for analysis of quantitative and qualitative aspects of gene expression. Nat Genet. 1992;2(3):173–179. doi: 10.1038/ng1192-173. - DOI - PubMed

Publication types

LinkOut - more resources