. 2014 Nov;28(11):4972-85.
doi: 10.1096/fj.14-257667. Epub 2014 Jul 28.

LKB1 and AMPK differentially regulate pancreatic β-cell identity

Affiliations

LKB1 and AMPK differentially regulate pancreatic β-cell identity

Marina Kone et al. FASEB J. 2014 Nov.

Abstract

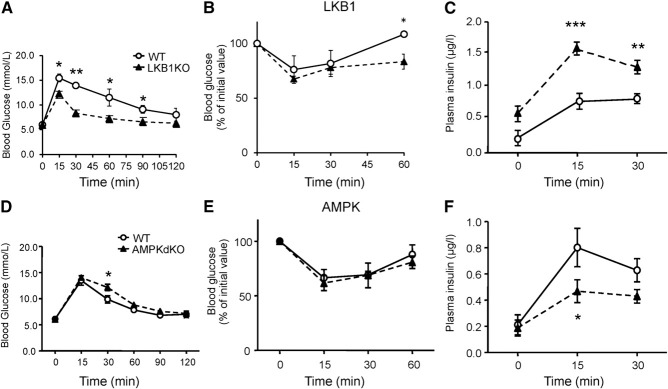
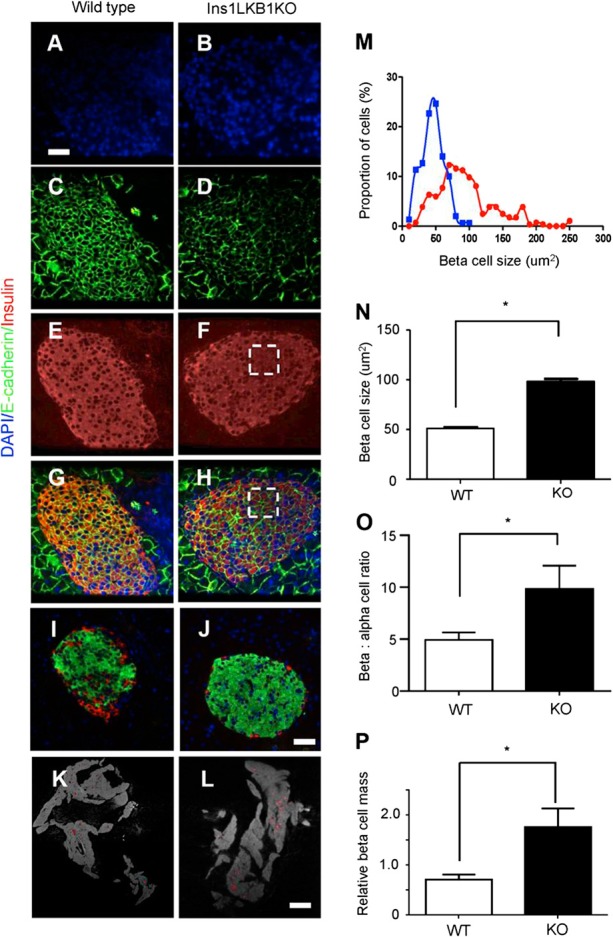
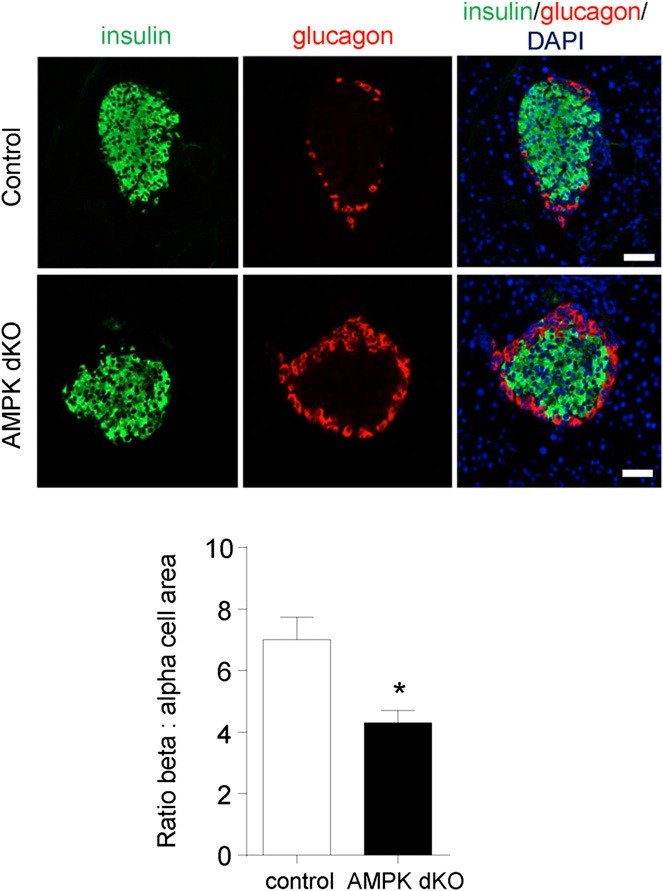
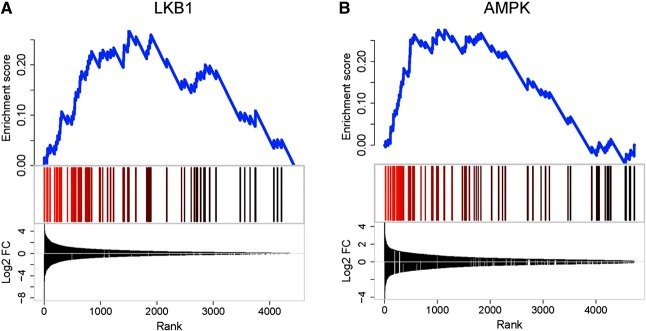
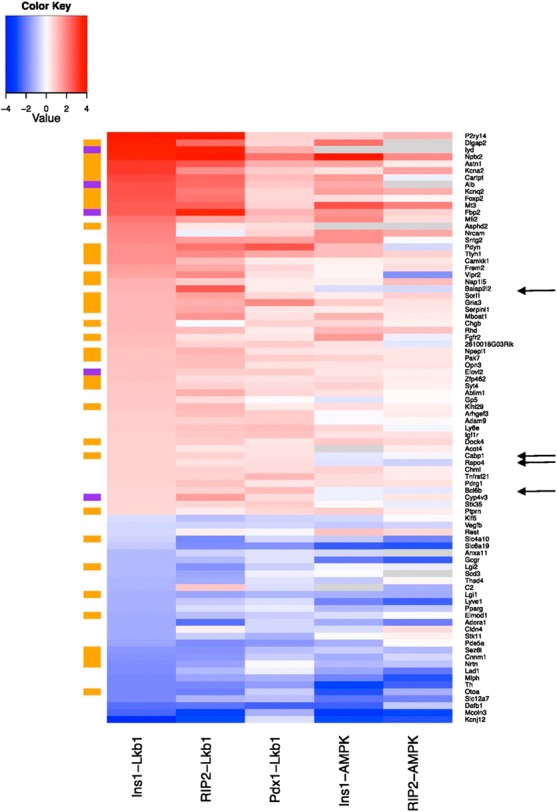
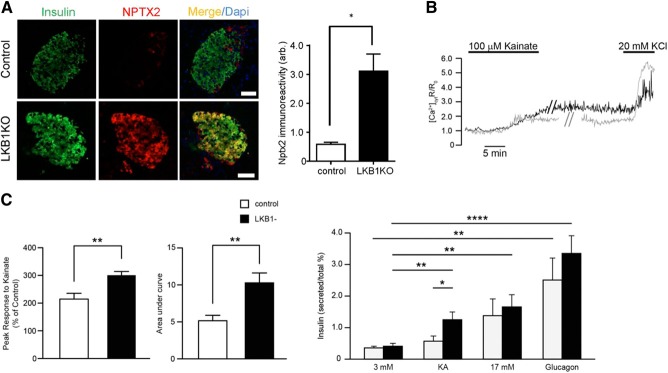
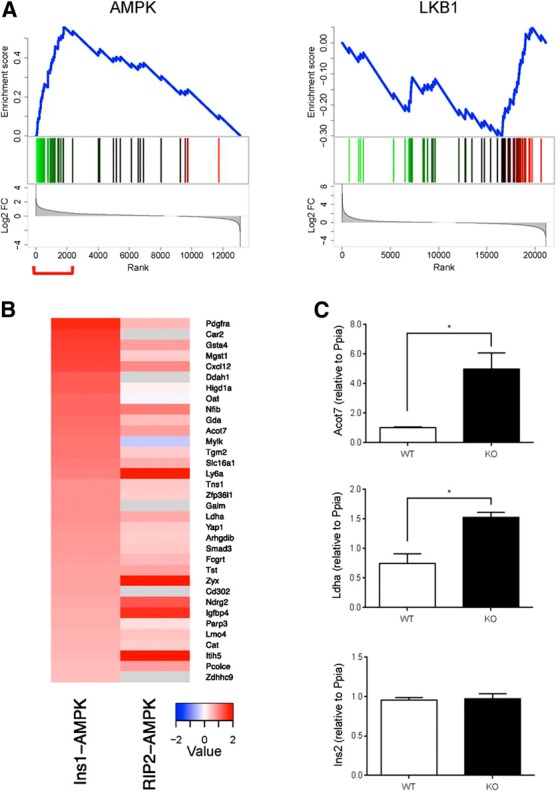
Fully differentiated pancreatic β cells are essential for normal glucose homeostasis in mammals. Dedifferentiation of these cells has been suggested to occur in type 2 diabetes, impairing insulin production. Since chronic fuel excess ("glucotoxicity") is implicated in this process, we sought here to identify the potential roles in β-cell identity of the tumor suppressor liver kinase B1 (LKB1/STK11) and the downstream fuel-sensitive kinase, AMP-activated protein kinase (AMPK). Highly β-cell-restricted deletion of each kinase in mice, using an Ins1-controlled Cre, was therefore followed by physiological, morphometric, and massive parallel sequencing analysis. Loss of LKB1 strikingly (2.0-12-fold, E<0.01) increased the expression of subsets of hepatic (Alb, Iyd, Elovl2) and neuronal (Nptx2, Dlgap2, Cartpt, Pdyn) genes, enhancing glutamate signaling. These changes were partially recapitulated by the loss of AMPK, which also up-regulated β-cell "disallowed" genes (Slc16a1, Ldha, Mgst1, Pdgfra) 1.8- to 3.4-fold (E < 0.01). Correspondingly, targeted promoters were enriched for neuronal (Zfp206; P = 1.3 × 10(-33)) and hypoxia-regulated (HIF1; P = 2.5 × 10(-16)) transcription factors. In summary, LKB1 and AMPK, through only partly overlapping mechanisms, maintain β-cell identity by suppressing alternate pathways leading to neuronal, hepatic, and other characteristics. Selective targeting of these enzymes may provide a new approach to maintaining β-cell function in some forms of diabetes.

Keywords: RNASeq; diabetes; insulin secretion; islet.


Figures

Figure 1.
Figure 1.
Glucose homeostasis and insulin secretion in Ins1LKB1KO and Ins1AMPKdKO mice. A–C) Glucose (1 g/kg intraperitoneal) tolerance (A), insulin (0.75 U/kg) tolerance (B), and glucose (3 g/kg)-induced insulin secretion (C) in WT or Ins1LKB1KO mice (10- to 12-wk-old males, n=3 WT, 5 KO). D–F) As in A–C but comparing WT (AMPKα1f/f:AMPKα2f/f) and Ins1AMPKdKO mice (n=5–10 mice/genotype). *P < 0.05, **P < 0.01 for effects of genotype.
Figure 2.
Figure 2.
LKB1 deletion increases β-cell size and mass in Ins1LKB1KO mice. A–J) Consecutive pancreatic sections from WT (A–I) or Ins1LKB1KO (B–J) mice were stained for DAPI (A, B), E-cadherin (C, D), insulin (E, F), insulin plus E-cadhrin (G, H), or insulin plus GCG (I, J). Scale bars = 20 μm. K, L) Representative optical tomography projections for whole pancreata from WT (K) and Ins1LKB1KO (L) mice. Scale bar = 400 μm. M, N) Distribution of β-cell sizes (M) and average β-cell size (N) was calculated from data as shown in C and D. O) Quantitation of the data in I and J. P) Quantification of OPT data from K and L. n = 3–6 mice/genotype. *P < 0.05; Student's t test.
Figure 3.
Figure 3.
Deletion of AMPK catalytic subunits with Ins1Cre alters islet β:α cell ratio. Pancreata from Ins1AMPKdKO mice and controls were fixed, sectioned, and subjected to immunocytochemical analysis for insulin and GCG as given in Materials and Methods. n = 3 mice/genotype in each case. *P < 0.05; paired Student's t test.
Figure 4.
Figure 4.
GSEA for neuronal genes in Ins1LKB1KO (A) or Ins1AMPKdKO (B) mice. A) GSEA was performed against MSigDB (V4) biological process gene ontolology categories (C5, BP) revealing significant enrichment for neuronal genes for Ins1LKB1KO [MSigDB category: NERVOUS_SYSTEM_DEVELOPMENT; Enrichment (ES) score=0.41 FDR=0.06]. In Ins1-AMPKdKO, this category was not significantly enriched (ES score=0.02; FDR=1; right panel). Data are expressed as absolute fold change irrespective of the direction of change. Blue line plot shows the cumulative ES score for this functional gene category. Vertical bars indicate the positions of the neuronal genes in the ranked differential expression lists. Line plot at the bottom shows the log2-fold changes of the genes in the ranked lists. Because the initial gene lists were ranked by absolute fold change, both up- and down-regulated genes are found at the top of the lists.
Figure 5.
Figure 5.
Differentially regulated genes after LKB1 or AMPK deletion in β cells. Heat map showing genes significantly up-regulated (red hues) or down-regulated (blue hues) by >1.4-fold in islets after deletion of the indicated kinases. Gray indicates genes absent from 1 or more samples (see Supplemental Tables S1 and S2). All genes shown were up-regulated in Ins1CreLKB1KO vs. control islets and ≥1 other LKB1KO model. Color bars at left indicate neuronal genes (brown) and liver-enriched genes (purple). Arrows indicate messages selectively enriched in LKB1 vs. AMPKdKO models.
Figure 6.
Figure 6.
Up-regulation of neuronal genes in Ins1LKB1KO mice is associated with enhanced glutamate signaling. A) Immuncytochemical analysis of pancreatic slices from the indicated mouse strains stained for NPTX2. Scale bar = 50 μm. B) Glutamate receptor signaling to increases in intracellular [Ca2+]cyt in control (gray trace; n=18) and Ins1LKB1KO (black; n=16) separate β cells, from 6 independent experiments. Mean amplitude of [Ca2+] peak and AUC in response to kainite were gathered from 7 WT and 6 Ins1LKB1KO mice. **P < 0.01. C) Insulin secretion in response to kainate and high glucose in islets from control and Ins1LKB1KO mice (n=4 animals/genotype). Incubations were performed in triplicate and involved 6 islets/tube. *P < 0.05, **P < 0.01, ****P < 0.0001.
Figure 7.
Figure 7.
GSEA for disallowed genes in Ins1LKB1KO and Ins1AMPKdKO mouse islets. A) Analyses were performed as described in Materials and Methods and in the legend to Fig. 4. Disallowed genes were selected as described previously (9, 10, 46). Here the differentially expressed genes were ranked by fold change (high to low) and tested for enrichment against the set of disallowed genes. Genes with increased expression are indicated in green, decreased expression in red. Plot at bottom indicates log2-fold changes of the genes. Ins1AMPKdKO and RIP2AMPKdKO show enrichment for disallowed genes among the genes that are up-regulated (left panel). In contrast, the situation with LKB1 is less clear, with Ins1LKB1KO showing enrichment for disallowed genes among the down-regulated genes (top right), and RIP2LKB1KO showing no clear enrichment for disallowed genes (bottom right). Red bracket indicates significantly enriched genes. B) Comparison of up-regulated disallowed genes in Ins1AMPKdKO and RIP2AMPKdKO mice. Heat maps show the ranking of disallowed gene changes. C) Acot7 and Ldha expression is up-regulated in β cells lacking AMPKα1/α2. Expression of Ins2, Acot7, and Ldha was measured by qRT-PCR in β cells sorted from islets corresponding to control and Ins1AMPKdKO mice (n=3 animals/genotype). The following specific primers were used: Ins2, 5′-CGTGGCTTCTTCTACACACCC-3′ and 5′-AGCTCCAGTTGTGCCACTTGT-3′, Acot7, 5′-TCTTCACCTACGTGTCCCTGAA-3′ and 5′-TCCGTCTCTGGCACAAGCT-3′ and Ldha, 5′-ATGAAGGACTTGGCGGATGA-3′ and 5′-ATCTCGCCCTTGAGTTTGTCTT-3′.Values were normalized to Ppia and expressed in relative quantities related to a control mouse. Data are shown as means ± sem. *P < 0.05.

References

    1. Scully T. (2012) Diabetes in numbers. Nature 485, S2–S3 - PubMed
    1. Rutter G. A., Parton L. E. (2008) The beta-cell in type 2 diabetes and in obesity. Front. Horm. Res. 36, 118–134 - PubMed
    1. Rutter G. A. (2001) Nutrient-secretion coupling in the pancreatic islet β-cell: recent advances. Mol. Aspects Med. 22, 247–284 - PubMed
    1. Butler A. E., Janson J., Bonner-Weir S., Ritzel R., Rizza R. A., Butler P. C. (2003) Beta-cell deficit and increased beta-cell apoptosis in humans with type 2 diabetes. Diabetes 52, 102–110 - PubMed
    1. Rahier J., Guiot Y., Goebbels R. M., Sempoux C., Henquin J. C. (2008) Pancreatic beta-cell mass in European subjects with type 2 diabetes. Diabetes Obes. Metab. 10, 32–42 - PubMed

Publication types

MeSH terms