Multicenter Study
. 2014 Aug;7(6):597-606.
doi: 10.1007/s12265-014-9577-1. Epub 2014 Jul 29.

Comprehensive biomarker testing of glycemia, insulin resistance, and beta cell function has greater sensitivity to detect diabetes risk than fasting glucose and HbA1c and is associated with improved glycemic control in clinical practice

Affiliations
Multicenter Study

Comprehensive biomarker testing of glycemia, insulin resistance, and beta cell function has greater sensitivity to detect diabetes risk than fasting glucose and HbA1c and is associated with improved glycemic control in clinical practice

Stephen A Varvel et al. J Cardiovasc Transl Res. 2014 Aug.

Abstract

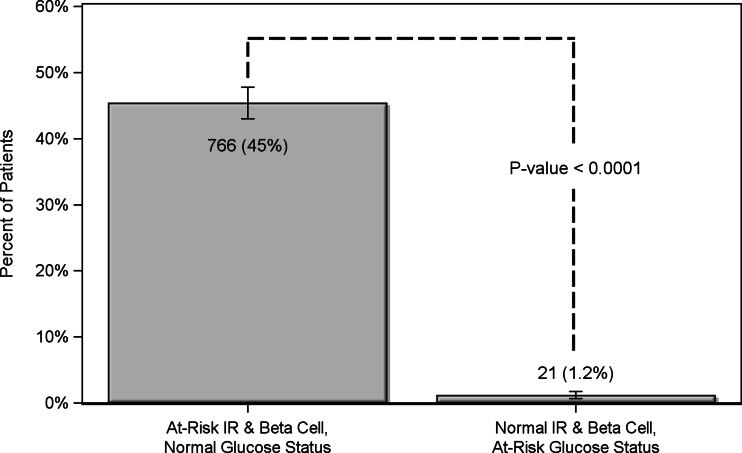
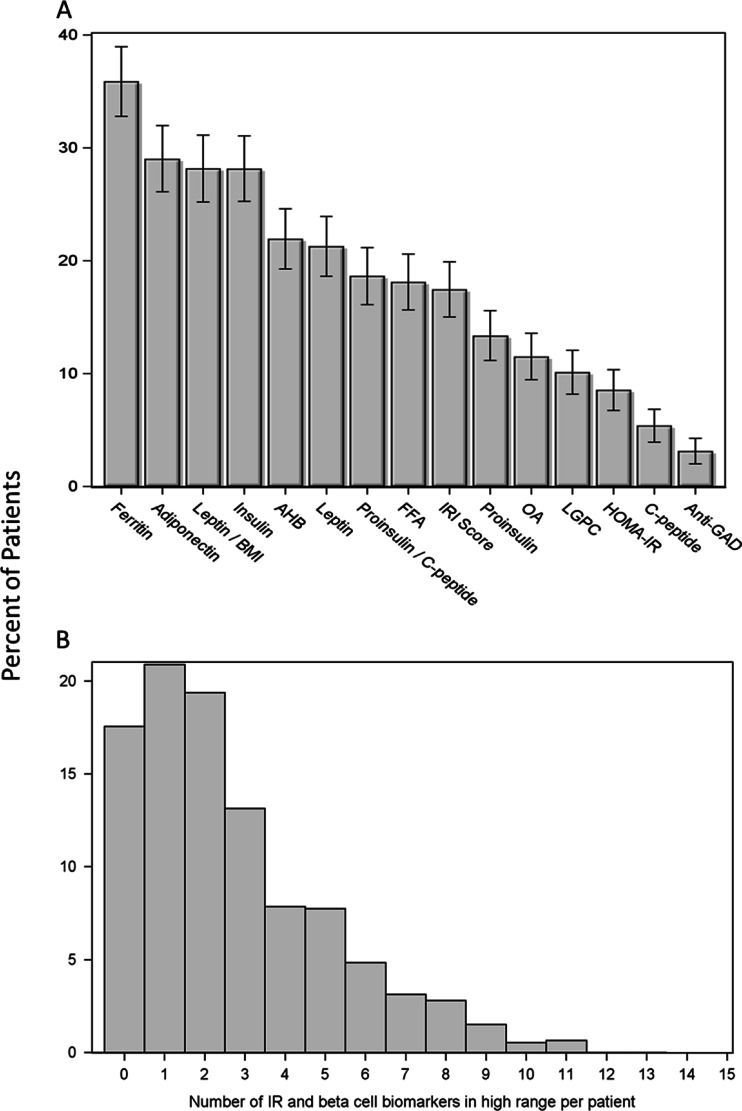
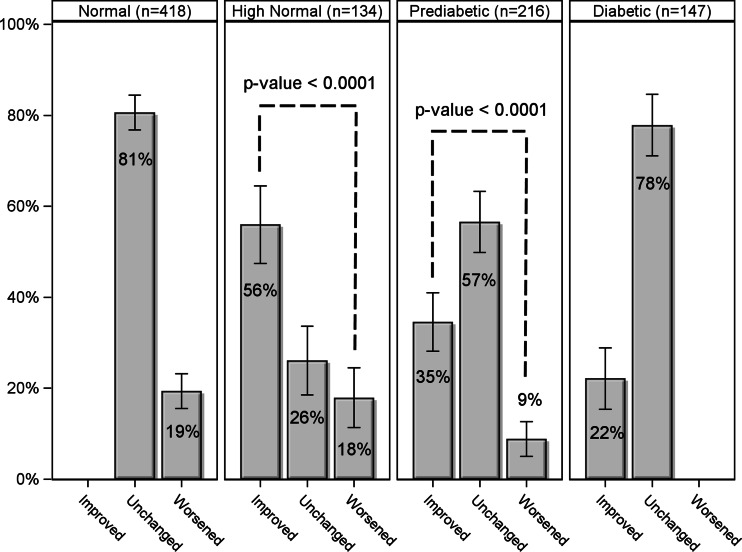
Blood-based biomarker testing of insulin resistance (IR) and beta cell dysfunction may identify diabetes risk earlier than current glycemia-based approaches. This retrospective cohort study assessed 1,687 US patients at risk for cardiovascular disease (CVD) under routine clinical care with a comprehensive panel of 19 biomarkers and derived factors related to IR, beta cell function, and glycemic control. The mean age was 53 ± 15, 42 % were male, and 25 % had glycemic indicators consistent with prediabetes. An additional 45 % of the patients who had normal glycemic indicators were identified with IR or beta cell abnormalities. After 5.3 months of median follow-up, significantly more patients had improved than worsened their glycemic status in the prediabetic category (35 vs. 9 %; P < 0.0001) and in the "high normal" category (HbA1c values of 5.5-5.6; 56 vs. 18 %, p < 0.0001). Biomarker testing can identify IR early, enable and inform treatment, and improve glycemic control in a high proportion of patients.


Conflict of interest statement

All authors employed by Health Diagnostic Laboratory, Inc., share a potential conflict of interest since this laboratory offers the referenced biomarker testing commercially. Timothy Graham has received consulting fees from Health Diagnostic Laboratory, Inc.

Figures

Fig. 1
Fig. 1
All patients were classified as at risk based on two criteria: first, high-range values of one or more biomarkers of insulin resistance (IR) or beta cell function, and second, traditional glycemic indicators (fasting glucose ≥ 100 mg/dL or HbA1c ≥ 5.7 %). The proportion of patients identified with one or more biomarkers of IR or beta cell function in the high range but normal glycemic indicators (glucose < 100 mg/dL and HbA1c < 5.7, N = 766) compared to the proportion of patients with abnormal glycemic but normal IR and beta cell function markers (N = 21) are shown. The two methods were in agreement for the remaining 900 patients. N = 1687, McNemar paired test p < 0.0001
Fig. 2
Fig. 2
Evidence of insulin resistance and beta cell dysfunction in the normoglycemic patients is highly prevalent and heterogenous. Of those patients classified as normoglycemic (glucose < 100 mg/dL and HbA1c < 5.7, N = 929), 82 % demonstrated at least one high range biomarker of insulin resistance or beta cell function. a Proportion of normoglycemic patients demonstrating high range values of each biomarker; 95 % confidence limits are shown. b Distribution of the total number of high range biomarker values observed in normoglycemic patients
Fig. 3
Fig. 3
Changes in glycemic category associated with care guided by comprehensive biomarker testing. Patients were categorized based on glucose and HbA1c values obtained at the initial visit as either normal (glucose < 100 mg/dL and HbA1c < 5.5, N = 418), high normal (glucose <100 mg/dL and HbA1c 5.5–5.6, N = 134), prediabetic (glucose 100–124 mg/dL or HbA1c 5.7–6.4, N = 216), or diabetic (glucose ≥125 mg/dL or HbA1c ≥6.5, N = 147). The proportion of patients within each category who improved (by at least one category), remained unchanged, or worsened (by at least one category) upon retest (the median follow-up was 5.3 months) are shown. Patients in the prediabetic and high normal categories were three to four times as likely to improve than worsened (p value <0.0001); 95 % confidence limits are shown

References

    1. Centers for Disease Control and Prevention (CDC). (2011). National diabetes fact sheet. Atlanta, Georgia.
    1. International Diabetes Federation (2013). IDF Diabetes Atlas, 6th edn. Brussels, Belgium: International Diabetes Federation. http://www.idf.org/diabetesatlas/global-burden. Accessed 24 July 2014.
    1. Roger VL, Go AS, Lloyd-Jones DM, et al. Heart disease and stroke statistics–2012 update: a report from the American Heart Association. Circulation. 2012;125(1):e2–e220. doi: 10.1161/CIR.0b013e31823ac046. - DOI - PMC - PubMed
    1. Go AS, Mozaffarian D, Roger VL, et al. Heart disease and stroke statistics–2013 update: a report from the American Heart Association. Circulation. 2013;127(1):e6–e245. doi: 10.1161/CIR.0b013e31828124ad. - DOI - PMC - PubMed
    1. DeFronzo RA, Abdul-Ghani MA. Preservation of beta-cell function: the key to diabetes prevention. Journal of Clinical Endocrinology and Metabolism. 2011;96(8):2354–2366. doi: 10.1210/jc.2011-0246. - DOI - PubMed

Publication types

LinkOut - more resources