. 2014 Sep 12;289(37):25936-45.
doi: 10.1074/jbc.M114.575308. Epub 2014 Jul 28.

Mitochondria are gate-keepers of T cell function by producing the ATP that drives purinergic signaling

Affiliations

Mitochondria are gate-keepers of T cell function by producing the ATP that drives purinergic signaling

Carola Ledderose et al. J Biol Chem. .

Abstract

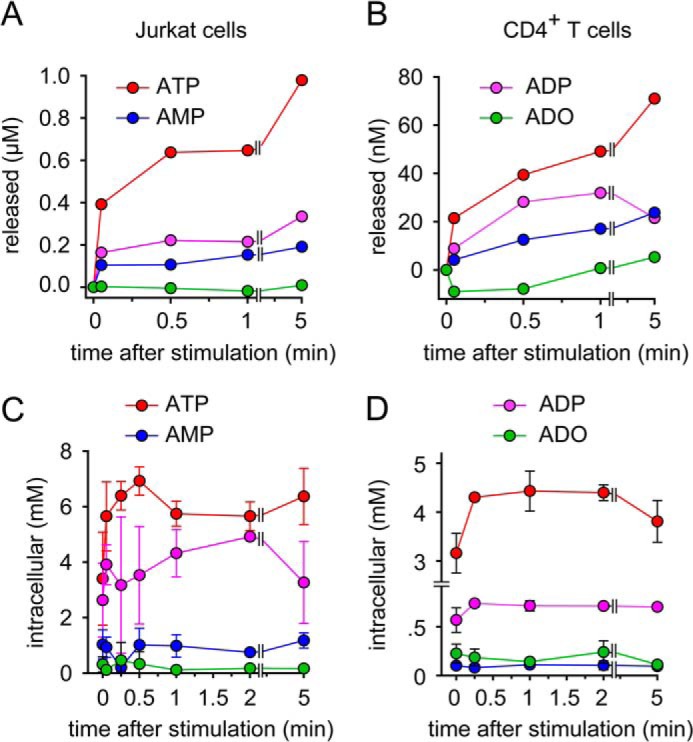
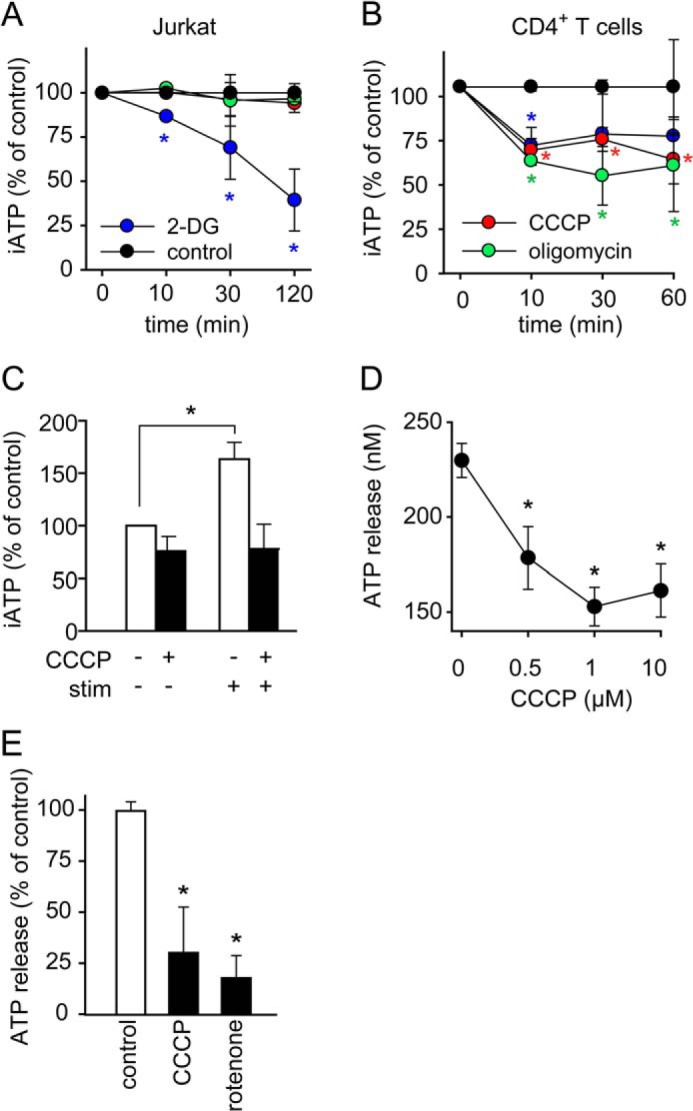
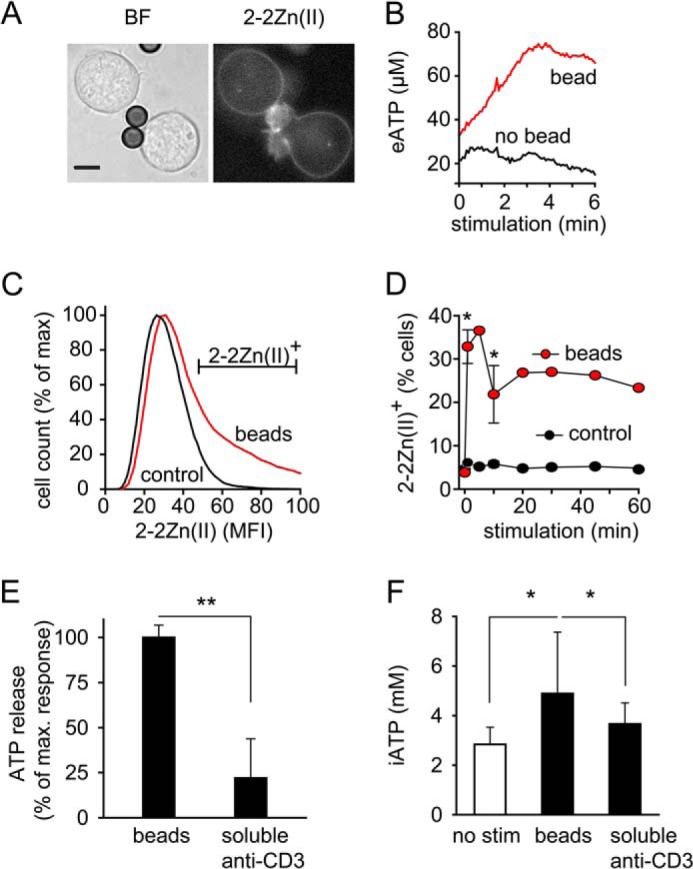
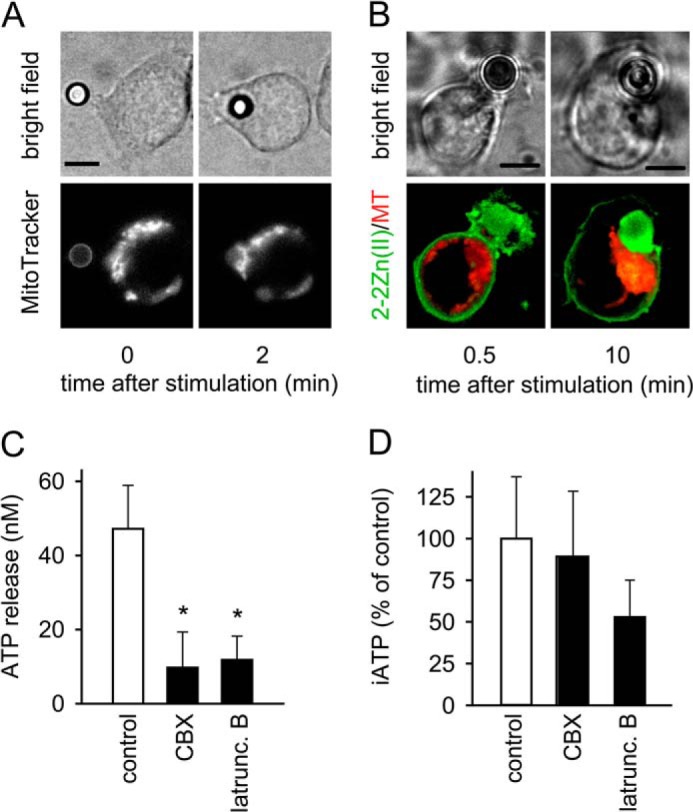
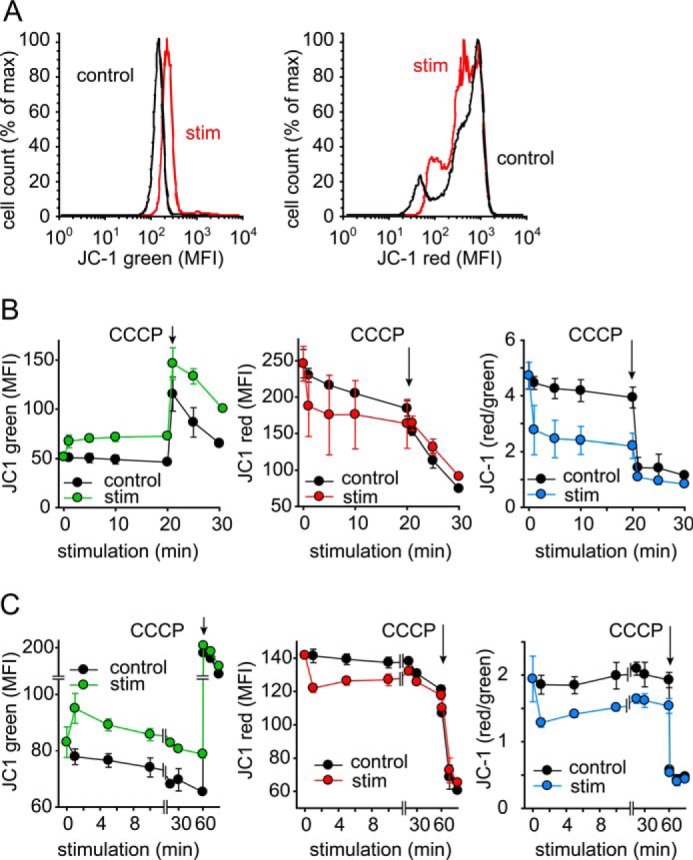
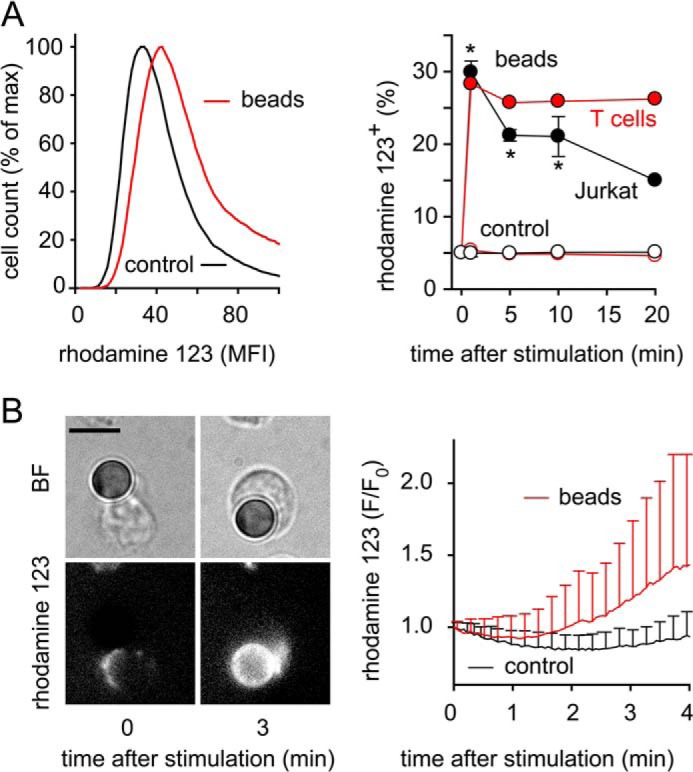
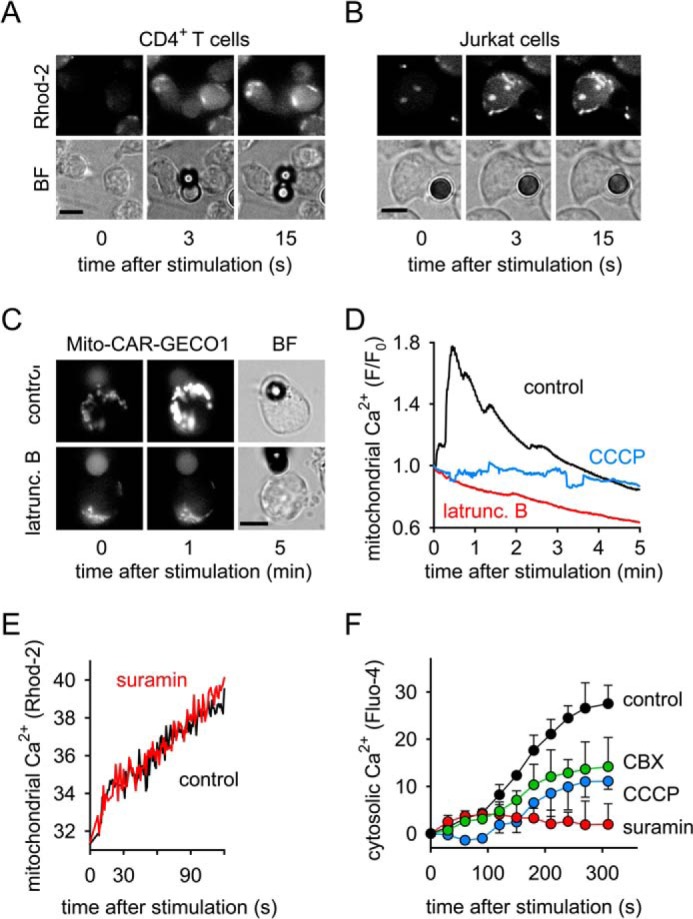
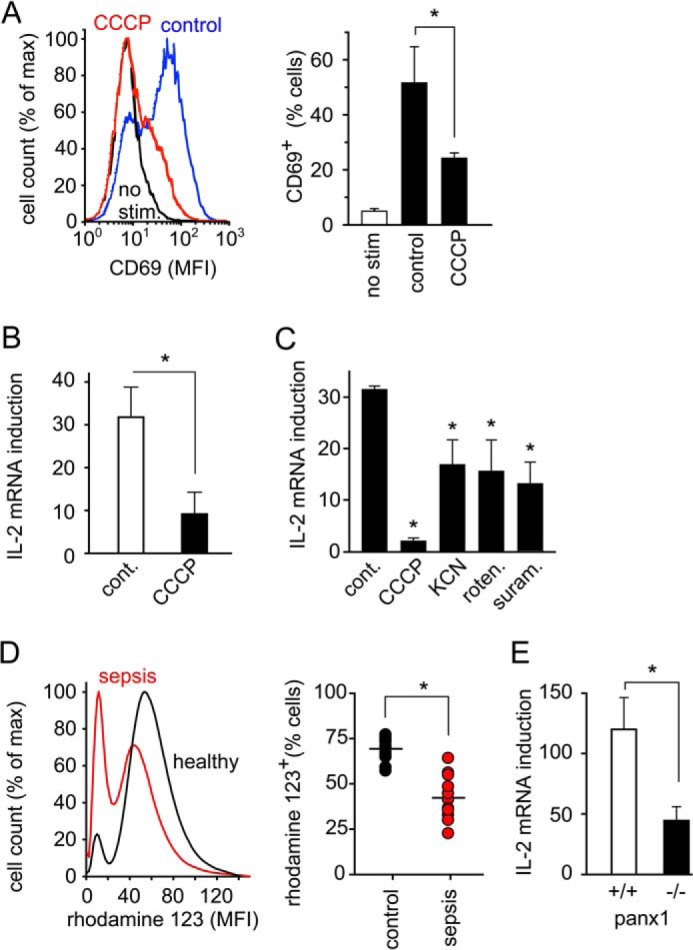
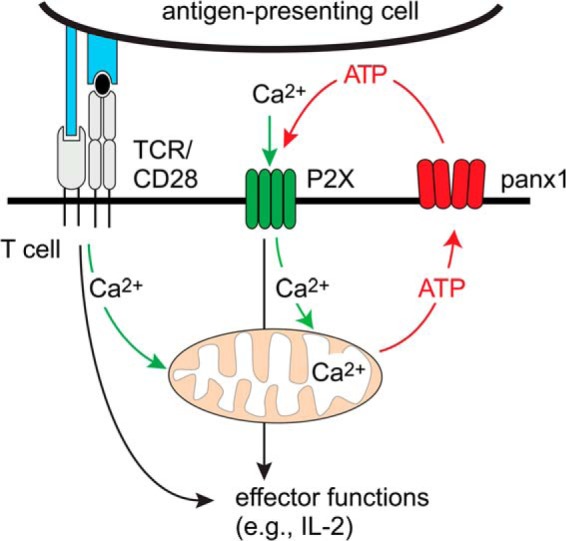
T cells play a central role in host defense. ATP release and autocrine feedback via purinergic receptors has been shown to regulate T cell function. However, the sources of the ATP that drives this process are not known. We found that stimulation of T cells triggers a spike in cellular ATP production that doubles intracellular ATP levels in <30 s and causes prolonged ATP release into the extracellular space. Cell stimulation triggered rapid mitochondrial Ca(2+) uptake, increased oxidative phosphorylation, a drop in mitochondrial membrane potential (Δψm), and the accumulation of active mitochondria at the immune synapse of stimulated T cells. Inhibition of mitochondria with CCCP, KCN, or rotenone blocked intracellular ATP production, ATP release, intracellular Ca(2+) signaling, induction of the early activation marker CD69, and IL-2 transcription in response to cell stimulation. These findings demonstrate that rapid activation of mitochondrial ATP production fuels the purinergic signaling mechanisms that regulate T cells and define their role in host defense.

Keywords: ATP; Calcium; Cellular Immune Response; Immunosuppression; Infectious Disease; Inflammation; Purinergic Receptor; Purinergic Signaling; T Cell.


Figures

FIGURE 1.
FIGURE 1.
T cell receptor stimulation triggers rapid ATP production and release. A and B, Jurkat cells (A) or primary CD4+ T cells (B) were stimulated with anti-CD3/CD28-coated beads for the indicated times, and concentrations of ATP, ADP, AMP, and adenosine (ADO) in the supernatant were measured with HPLC. C and D, intracellular ATP, ADP, AMP, and adenosine levels were determined in Jurkat cells (C) or CD4+ T cells (D) stimulated with anti-CD3/CD28 beads using HPLC. Data shown are representative of n = 3–6 experiments with similar results.
FIGURE 2.
FIGURE 2.
Mitochondria generate the ATP that is released by stimulated T cells. A and B, resting Jurkat cells derive their ATP mainly from glycolysis and primary CD4+ T cells mainly from mitochondrial oxidative phosphorylation. Jurkat cells (A) or CD4+ T cells (B) were treated with vehicle control (black), 2-DG (20 mm, blue) to block glycolysis or CCCP (10 μm, red) or oligomycin (10 μm, green) to inhibit mitochondrial ATP production for the indicated times, and intracellular ATP (iATP) levels were measured with a luciferase bioluminescence assay. Data show means ± S.D. of n = 4 independent experiments; *, p < 0.05 versus control. C, Jurkat cells were treated with CCCP (1 μm) for 10 min, stimulated with anti-CD3/CD28 coated beads for 30 s, and iATP was assessed by HPLC. Data represent means ± S.D. of n = 3 separate experiments; *, p < 0.05. D and E, Jurkat cells (D) were treated with the indicated concentrations of CCCP and CD4+ T cells (E) were treated with CCCP (1 μm), rotenone (1 μm) or vehicle control for 10 min and ATP release into the supernatant was measured with a bioluminescence assay after stimulating cells for 30 s with anti-CD3/CD28-coated beads. Data represent means ± S.D. (n = 3); *, p < 0.05 versus control.
FIGURE 3.
FIGURE 3.
T cell receptor/CD28 stimulation triggers ATP release at the immune synapse. A and B, Jurkat cells stained with the membrane-bound fluorescent ATP probe 2–2Zn(II) were stimulated with anti-CD3/CD28 antibody-coated beads, and ATP release at the IS was visualized with epifluorescence microscopy and analyzed over time (A; scale bar, 5 μm; 63× oil objective, NA 1.4; see also supplemental Movie S1). B, representative fluorescence traces at sites of bead/cell contact and of basal surface ATP release (eATP) at opposite cell regions are shown. ATP concentrations at the cell surface were estimated by addition of ATP standards of known concentrations. C and D, Jurkat cells were stained with 2–2Zn(II), stimulated with beads or not (control), and ATP release was analyzed with flow cytometry. Representative histograms 20 min after stimulation (C) and the percentage of cells releasing ATP at indicated times after stimulation are shown (D). Data are means ± S.D.; n = 2–3; *, p < 0.05 versus control. E and F, Jurkat cells were stimulated with beads coated with anti-CD3/CD28 antibodies or with soluble anti-CD3 (0.5 μg/ml) for 1 min, and ATP release into the supernatant (E) or intracellular ATP concentrations (F) were determined. Data shown are means ± S.D. (n = 6); *, p < 0.05; **, p < 0.01.
FIGURE 4.
FIGURE 4.
Mitochondrial accumulation at the immune synapse drives localized ATP release. A, Jurkat cells were loaded with MitoTracker Red CM-H2XRos, stimulated with anti-CD3/CD28 antibody-coated beads, and translocation of mitochondria to the IS was observed by epifluorescence time-lapse imaging (100× oil objective, NA 1.3; 2 s interval; see also supplemental Movie S2). B, ATP release and location of mitochondria was assessed in Jurkat cells stained with 2–2Zn(II) (for ATP detection; green) and MitoTracker Red CM-H2XRos (for mitochondrial staining; red) during formation of an immune synapse (IS; left) or after establishing of the bead/cell contact (100× oil objective, NA 1.4; z-stack projections, 0.1 μm slice increment; see also supplemental Movie S3). MT, MitoTracker; scale bars, 5 μm. C and D, Jurkat cells were treated or not (control) with CBX (20 μm) or latrunculin B (10 μg/ml) for 20 min. ATP concentrations in the supernatant (C) or inside the cells (D) were determined after stimulation for 1 min with anti-CD3/CD28 antibody-coated beads. Data shown are means ± S.D. (n = 3–8); *, p < 0.05.
FIGURE 5.
FIGURE 5.
TCR stimulation decreases the mitochondrial membrane potential Δψm in T cells. CD4+ T cells (A and B) or Jurkat cells (C) were stained with JC-1, stimulated with anti-CD3/CD28-coated beads for the indicated periods of time, and red and green JC-1 fluorescence was recorded with a flow cytometer. Representative histograms after 20 min stimulation are shown in A. CCCP (10 μm) was added as a control for maximal depolarization. Data are means ± S.D. of n = 3–4 independent experiments.
FIGURE 6.
FIGURE 6.
Stimulation rapidly increases mitochondrial ROS production in T cells. A and B, mitochondrial ROS production was measured with DHR to assess mitochondrial activation. Panel A shows representative histograms of Jurkat cells (left) or the percentage of ROS producing Jurkat and CD4+ T cells (right) stimulated for the indicated times with beads and analyzed by flow cytometry; gating was done for cells attached or not attached (control) to beads, respectively; n = 2–4; *, p < 0.05 versus control. B, CD4+ T cells loaded with DHR were stimulated with beads, and ROS formation was monitored by time-lapse fluorescence video microscopy (left) and analyzed with image analysis software (right; mean ± S.D. of 19 stimulated and 23 unstimulated cells of three independent experiments); BF, bright field image; scale bar, 5 μm; see also supplemental Movie S4.
FIGURE 7.
FIGURE 7.
Rapid mitochondrial activation and Ca2+ influx precede sustained cytosolic Ca2+ signaling. A and B, primary human CD4+ T cells (A) and Jurkat cells (B) were loaded with the mitochondrial Ca2+ probe Rhod-2, stimulated with anti-CD3/CD28 antibody-coated beads, and mitochondrial Ca2+ firing was assessed with live-cell imaging (100× oil objective, NA 1.3; see also s u p p l em e n t a l M o v i e s S 5 a n d S 6). C and D, Jurkat cells expressing the mitochondrial Ca2+ biosensor mito-CAR-GECO1 were treated or not (control) with latrunculin B (10 μg/ml) or CCCP (10 μm) for 10 min and stimulated with anti-CD3/CD28 antibody-coated beads. Changes in mitochondrial Ca2+ were observed by time-lapse fluorescence video microscopy (time interval: 1s; 63× oil objective, NA 1.4) and analyzed with image analysis software (D; each trace represents the mean of n = 10 stimulated cells of 2 independent experiments). BF, bright field image; scale bars: 5 μm; see also supplemental Movie S7. E, Jurkat cells were loaded with the mitochondrial Ca2+ probe Rhod-2, treated (red line) or not (control; black line) with the P2X receptor inhibitor suramin (200 μm) for 10 min, stimulated with anti-CD3/CD28 antibody-coated beads, and analyzed with a fluorescence spectrophotometer. Data shown are means of three separate experiments. F, Jurkat cells were loaded with the cytosolic Ca2+ probe Fluo-4, treated or not (control) with suramin (200 μm; red), CCCP (1 μm; blue), or the panx1 blocker CBX (30 μm; green) for 10 min, stimulated with beads, and changes in cytosolic Ca2+ levels were monitored with flow cytometry; data shown are means ± S.D. of n = 3 independent experiments.
FIGURE 8.
FIGURE 8.
Proper T cell effector functions require mitochondrial ATP production. A, Jurkat cells were treated (red line) or not (black and blue line) with CCCP (1 μm) for 10 min and stimulated or not (black line) for 30 min with anti-CD3/CD28 beads. The expression of the early T cell activation marker CD69 was analyzed by flow cytometry. Representative histograms are depicted in the left panel. B and C, IL-2 mRNA expression was measured in Jurkat cells (B) or primary CD4+ T cells (C) stimulated with anti-CD3/CD28 beads for 30 min in the presence or absence (control) of blockers of mitochondrial function (CCCP, 1 μm; KCN, 500 μm; rotenone, 1 μm) or the P2X receptor inhibitor suramin (200 μm); data are means of n = 3–5 independent experiments; *, p < 0.05 versus control. D, mitochondrial function is impaired in sepsis patients. Mitochondrial ROS production was assessed in lymphocytes from septic patients (n = 10) and healthy subjects (n = 13) using DHR and flow cytometry. Representative histograms are shown on the left. MFI, mean fluorescence intensity; *, p < 0.05. E, transcription of IL-2 mRNA after CD3/CD28 stimulation (4 h) in splenocytes of panx1 knock-out or wild type mice; n = 5 animals per group, *, p < 0.05.
FIGURE 9.
FIGURE 9.
Proposed model of the regulation of Ca2+ and purinergic signaling by mitochondrial firing. TCR/CD28 stimulation triggers Ca2+ release from intracellular stores, resulting in mitochondrial Ca2+ firing and ATP production that feeds autocrine purinergic signaling and prolonged Ca2+ influx via P2X1 and P2X4 receptors at the immune synapse.

References

    1. Hotchkiss R. S., Monneret G., Payen D. (2013) Immunosuppression in sepsis: a novel understanding of the disorder and a new therapeutic approach. Lancet Infect. Dis. 13, 260–268 - PMC - PubMed
    1. Hotchkiss R. S., Monneret G., Payen D. (2013) Sepsis-induced immunosuppression: from cellular dysfunction to immunotherapy. Nat. Rev. Immunol. 13, 862–874 - PMC - PubMed
    1. Schenk U., Westendorf A. M., Radaelli E., Casati A., Ferro M., Fumagalli M., Verderio C., Buer J., Scanziani E., Grassi F. (2008) Purinergic control of T cell activation by ATP released through pannexin-1 hemichannels. Sci. Signal 1, ra6. - PubMed
    1. Yip L., Woehrle T., Corriden R., Hirsh M., Chen Y., Inoue Y., Ferrari V., Insel P. A., Junger W. G. (2009) Autocrine regulation of T-cell activation by ATP release and P2X7 receptors. FASEB J. 23, 1685–1693 - PMC - PubMed
    1. Woehrle T., Yip L., Elkhal A., Sumi Y., Chen Y., Yao Y., Insel P. A., Junger W. G. (2010) Pannexin-1 hemichannel-mediated ATP release together with P2X1 and P2X4 receptors regulate T-cell activation at the immune synapse. Blood 116, 3475–3484 - PMC - PubMed

Publication types

MeSH terms

Substances