. 2015 May 23;9(3):370-80.
doi: 10.5009/gnl13408.

Expression of TIM-3, Human β-defensin-2, and FOXP3 and Correlation with Disease Activity in Pediatric Crohn's Disease with Infliximab Therapy

Affiliations

Expression of TIM-3, Human β-defensin-2, and FOXP3 and Correlation with Disease Activity in Pediatric Crohn's Disease with Infliximab Therapy

Mi Jin Kim et al. Gut Liver. .

Abstract

Background/aims: This study investigated the expression of T cell immunoglobulin- and mucin-domain-containing molecule 3 (TIM-3), human β-defensin (HBD)-2, forkhead box protein 3 (FOXP3), and the frequency of CD4(+) CD25(+) FOXP3(+) regulatory T cells (Tregs) in children with Crohn's disease (CD) during infliximab therapy.

Methods: We enrolled 20 CD patients who received infliximab treatment for 1 year. Peripheral blood and colonic mucosal specimens were collected from all CD patients and from healthy control individuals.

Results: A significant difference in TIM-3 mRNA expression was evident in peripheral blood mononuclear cells and colonic mucosa between CD patients before infliximab therapy and the healthy controls (p<0.001 and p=0.005, respectively). A significant difference in HBD-2 mRNA expression was found in colonic mucosa between CD patients before infliximab therapy and the healthy controls (p=0.013). In the active phase of CD, at baseline, the median percentage of T cells that were CD25(+) FOXP3(+) was 1.5% (range, 0.32% to 3.49%), which increased after inflixmab treatment for 1 year to 2.2% (range, 0.54% to 5.02%) (p=0.008).

Conclusions: Our study suggests that both the adaptive and innate immune systems are closely linked to each other in CD pathogenesis. And the results of our study indicate that it could be a useful therapeutic tool, where restoration of TIM-3, HBD-2 and the function of Tregs may repair the dysfunctional immunoregulation in CD.

Keywords: Crohn disease; Human beta-defensins-2; Infliximab; T-cell immunoglobulin- and mucin-domain-containing molecule 3; forkhead box protein 3.


Figures

Fig. 1
Fig. 1
Diagrammatic flow of the study.
Fig. 2
Fig. 2
Expression of tumor necrosis factor α (TNF-α) in peripheral blood and its correlation with disease activity. The plasma level of TNF-α in the Crohn’s disease (CD) patients and healthy controls was determined by enzyme-linked immunosorbent assay. The TNF-α levels in the serum of CD patients before infliximab therapy (IFX Tx) was higher than that of the healthy controls (p=0.026). After the IFX Tx, the level of TNF-α was decreased compared with that before therapy (p=0.044). Box plots define the values for the median, range, and 25th and 75th percentiles. The range is represented by the upper and lower limits of the vertical lines.
Fig. 3
Fig. 3
Expression of T cell immunoglobulin- and mucin-domain-containing molecule 3 (TIM-3) mRNA in peripheral blood mononuclear cells (PBMCs) and its correlation with disease activity. (A) Expression of TIM-3 mRNA in the PBMCs of Crohn’s disease (CD) patients and healthy controls was determined by real-time reverse transcription-polymerase chain reaction. The TIM-3 mRNA expression in the PBMCs of CD patients before infliximab therapy (IFX Tx) was significantly lower than that in the healthy controls (p<0.001). After IFX Tx, the TIM-3 mRNA expression was increased compared with that before therapy (p=0.007). Box plots define the values for the median, range, and 25th and 75th percentiles. The range is represented by the upper and lower limits of the vertical lines. (B) Negative correlation of the TIM-3 mRNA expression in the PBMCs of CD patients with respect to the Pediatric Crohn’s Disease Activity Index (PCDAI) during IFX Tx (r2=0.201, p=0.004).
Fig. 4
Fig. 4
Expression of T cell immunoglobulin- and mucin-domain-containing molecule 3 (TIM-3) mRNA in the colonic mucosa and its correlation with disease activity. (A) The expression of TIM-3 mRNA in the colonic mucosa of the Crohn’s disease (CD) patients and healthy controls was determined by real-time reverse transcription-polymerase chain reaction. The TIM-3 mRNA expression in the colonic mucosa of CD patients before infliximab therapy (IFX Tx) was significantly higher than that in the healthy controls (p=0.005). After IFX Tx, TIM-3 mRNA expression was decreased compared with that before therapy (p=0.037). Box plots define the values for the median, range, and 25th and 75th percentiles. The range is represented by the upper and lower limits of the vertical lines. (B) Positive correlation of TIM-3 mRNA expression in the colonic mucosa of CD patients with respect to the Pediatric Crohn’s Disease Activity Index (PCDAI) during IFX Tx (r2=0.132, p=0.021).
Fig. 5
Fig. 5
Expression of human β-defensin (HBD)-2 mRNA in the colonic mucosa and its correlation with disease activity. (A) The expression of HBD-2 mRNA in the colonic mucosa of the Crohn’s disease (CD) patients and healthy controls was determined by real-time reverse transcription-polymerase chain reaction. The HBD-2 mRNA expression in the colonic mucosa of CD patients before infliximab therapy (IFX Tx) was significantly higher than that in the healthy controls (p=0.013). After IFX Tx, HBD-2 mRNA expression was decreased compared with that before therapy (p=0.017). Box plots define the values for the median, range, and 25th and 75th percentiles. The range is represented by the upper and lower limits of the vertical lines. (B) A negative correlation was found between the T cell immunoglobulin- and mucin-domain-containing molecule 3 (TIM-3) mRNA expression in peripheral blood mononuclear cells and the HBD-2 mRNA expression in the colonic mucosa in the CD patients (r2=0.344, p=0.007). (C) Correlation of HBD-2 mRNA expression in the colonic mucosa with the clinical disease activity index during IFX Tx (r2=0.074, p=0.091).
Fig. 6
Fig. 6
CD4+ CD25+ FOXP3+ Tregs in peripheral blood. (A) Representative dot plot of forkhead box protein 3 (FOXP3) and CD25 staining in CD4+ peripheral blood lymphocytes from one patient before and after infliximab therapy (IFX Tx). (B) Comparison of the percentage of CD4+ CD25+ FOXP3+ cells before and after IFX Tx. Box plots define the values for the median, range, and 25th and 75th percentiles. The range is represented by the upper and lower limits of the vertical lines. (C) A nagative correlation of the percentage of CD4+ CD25+ FOXP3+ cells with respect to the Pediatric Crohn’s Disease Activity Index (PCDAI) during IFX Tx (r2=0.604, p<0.001).
Fig. 7
Fig. 7
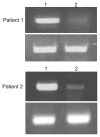
Forkhead box protein 3 (FOXP3) mRNA expression in the colonic mucosa from two patients before and after infliximab therapy. The numerals 1 and 2 represent before and after infliximab therapy, respectively. The upper line is the FOXP3 mRNA band, and the lower line is the GAPDH band.
Fig. 8
Fig. 8
Expression of the T cell immunoglobulin- and mucin-domain-containing molecule 3 (TIM-3) and forkhead box protein 3 (FOXP3) proteins in the colonic mucosa of patients with Crohn’s disease (CD) before and after infliximab therapy and normal controls. The immunoreactive TIM-3 protein in normal controls (A) was compared with that in CD patients before (B) and after (C) infliximab therapy by immunohistochemical analysis using anti-TIM-3 antibodies as described in the Materials and Methods section. The immunoreactive FOXP3 protein in CD patients before (E) and after (F) infliximab therapy was compared with that in normal controls (D) by immunohistochemical analysis using anti-FOXP3 antibodies as described in the Materials and Methods section (×400).

Comment in

References

    1. Xavier RJ, Podolsky DK. Unravelling the pathogenesis of inflammatory bowel disease. Nature. 2007;448:427–434. doi: 10.1038/nature06005. - DOI - PubMed
    1. Travis SP, Stange EF, Lémann M, et al. European evidence based consensus on the diagnosis and management of Crohn’s disease: current management. Gut. 2006;55(Suppl 1):i16–i35. doi: 10.1136/gut.2005.081950b. - DOI - PMC - PubMed
    1. Lémann M, Mary JY, Duclos B, et al. Infliximab plus azathioprine for steroid-dependent Crohn’s disease patients: a randomized placebo-controlled trial. Gastroenterology. 2006;130:1054–1061. doi: 10.1053/j.gastro.2006.02.014. - DOI - PubMed
    1. Mayer L. Evolving paradigms in the pathogenesis of IBD. J Gastroenterol. 2010;45:9–16. doi: 10.1007/s00535-009-0138-3. - DOI - PubMed
    1. Mizoguchi A, Mizoguchi E. Inflammatory bowel disease, past, present and future: lessons from animal models. J Gastroenterol. 2008;43:1–17. doi: 10.1007/s00535-007-2111-3. - DOI - PubMed

Publication types

Supplementary concepts