. 2014 Oct 1;34(19):3689-701.
doi: 10.1128/MCB.00341-14. Epub 2014 Jul 28.

p66ShcA promotes breast cancer plasticity by inducing an epithelial-to-mesenchymal transition

Affiliations

p66ShcA promotes breast cancer plasticity by inducing an epithelial-to-mesenchymal transition

Jesse Hudson et al. Mol Cell Biol. .

Abstract

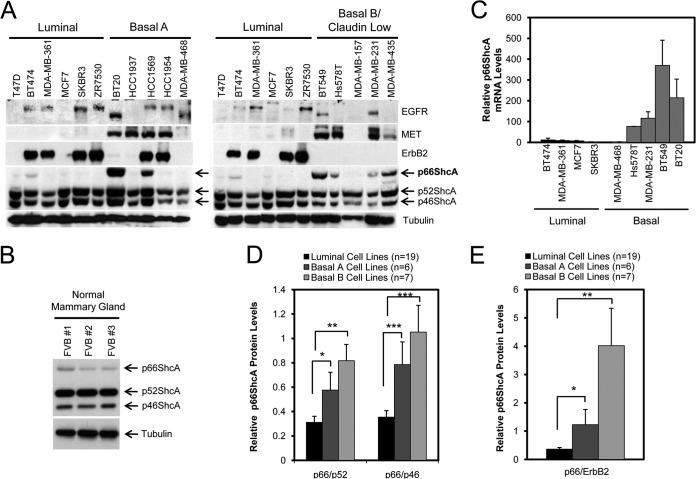
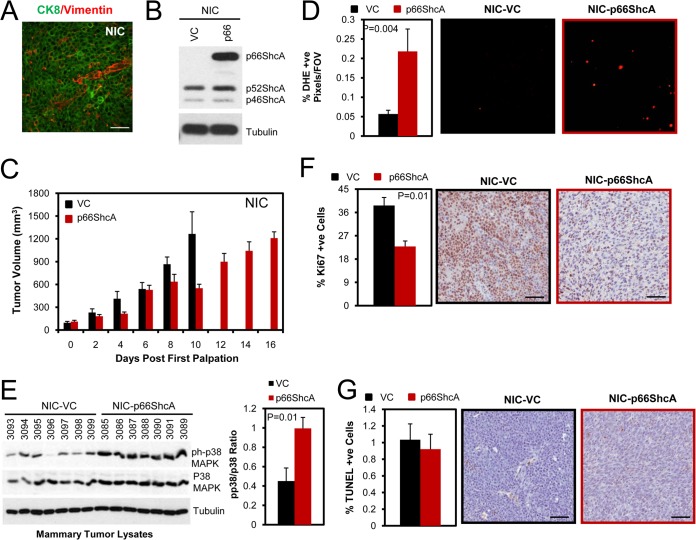
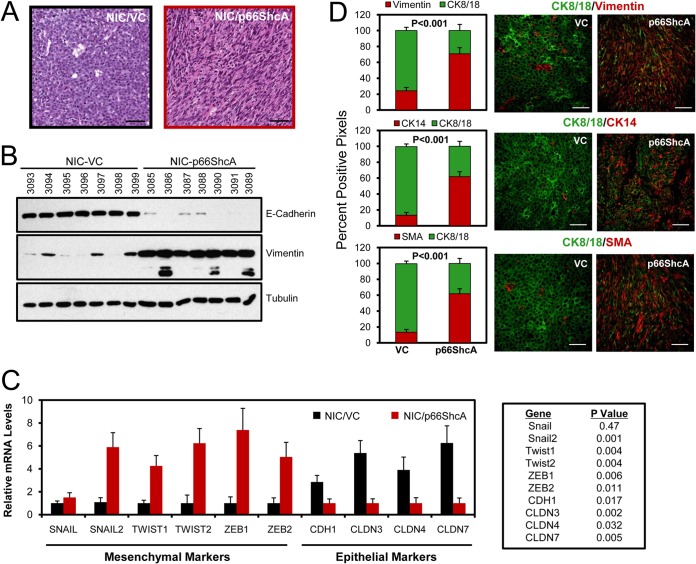
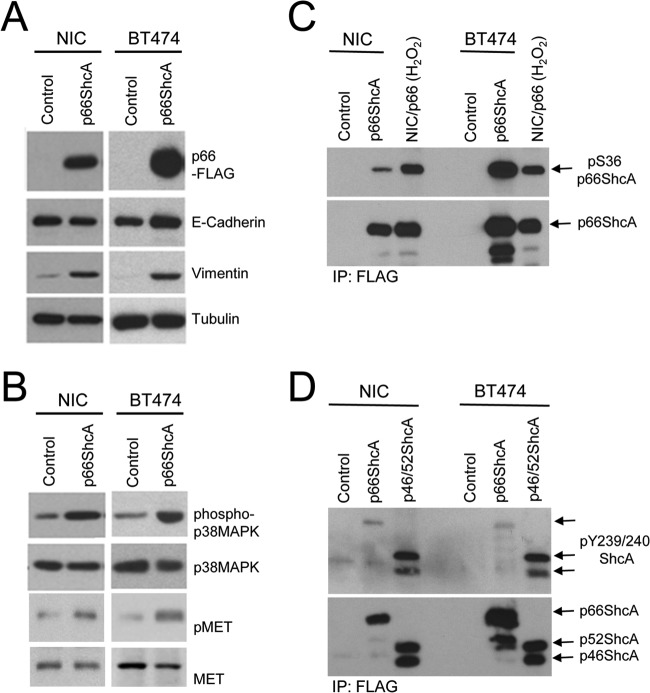
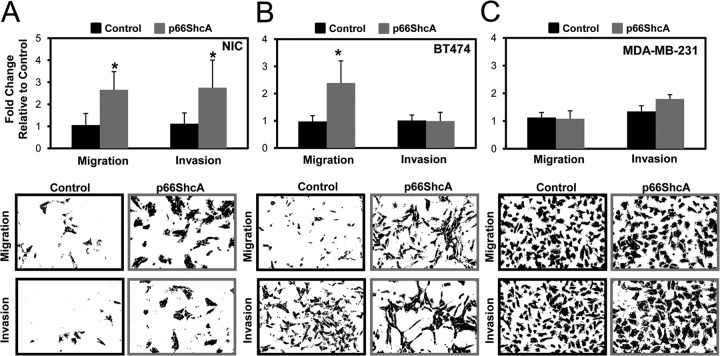
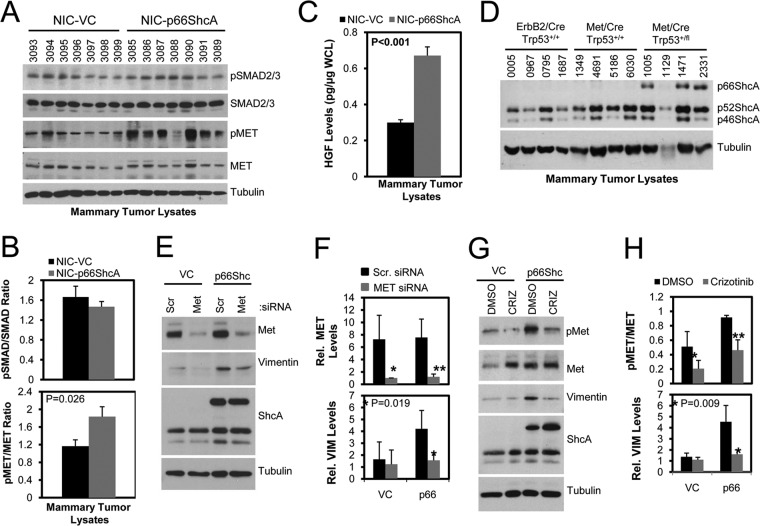
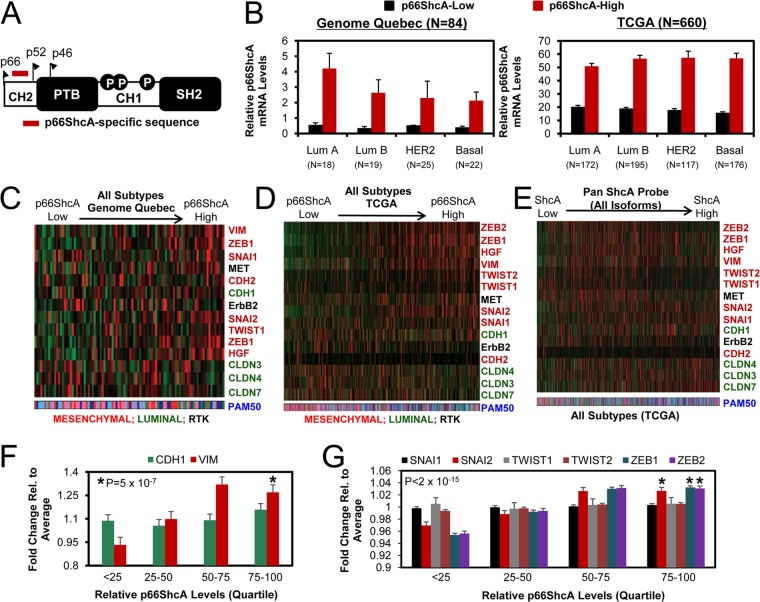
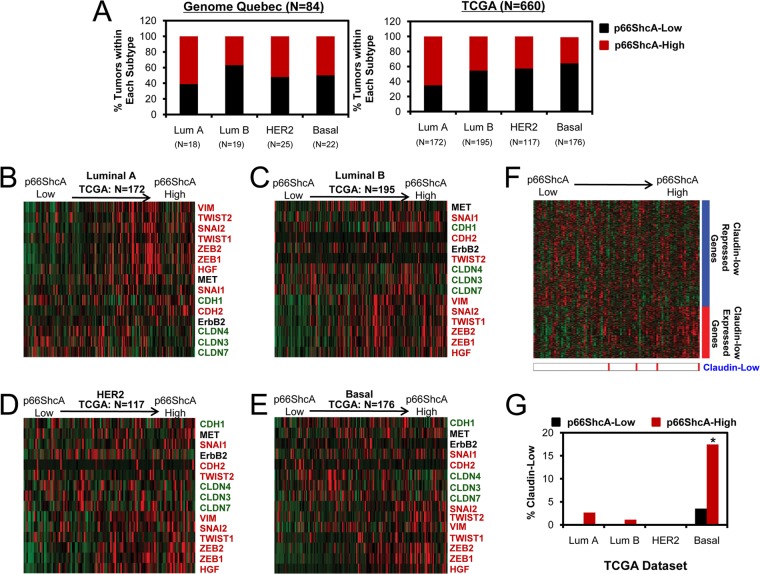
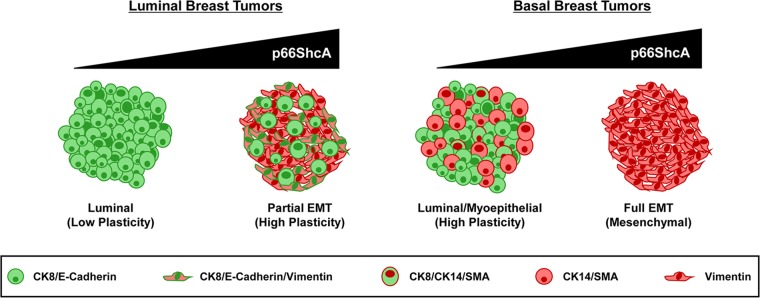
Breast cancers are stratified into distinct subtypes, which influence therapeutic responsiveness and patient outcome. Patients with luminal breast cancers are often associated with a better prognosis relative to that with other subtypes. However, subsets of patients with luminal disease remain at increased risk of cancer-related death. A critical process that increases the malignant potential of breast cancers is the epithelial-to-mesenchymal transition (EMT). The p66ShcA adaptor protein stimulates the formation of reactive oxygen species in response to stress stimuli. In this paper, we report a novel role for p66ShcA in inducing an EMT in HER2(+) luminal breast cancers. p66ShcA increases the migratory properties of breast cancer cells and enhances signaling downstream of the Met receptor tyrosine kinase in these tumors. Moreover, Met activation is required for a p66ShcA-induced EMT in luminal breast cancer cells. Finally, elevated p66ShcA levels are associated with the acquisition of an EMT in primary breast cancers spanning all molecular subtypes, including luminal tumors. This is of high clinical relevance, as the luminal and HER2 subtypes together comprise 80% of all newly diagnosed breast cancers. This study identifies p66ShcA as one of the first prognostic biomarkers for the identification of more aggressive tumors with mesenchymal properties, regardless of molecular subtype.


Figures

FIG 1
FIG 1
p66ShcA is enriched in basal breast cancer cell lines. (A) Immunoblot analysis of whole-cell lysates using ShcA-, MET-, EGFR-, ErbB2-, and tubulin-specific antibodies. Cells are classified as luminal or basal (A or B) as described previously (5). Note that the same lysates from the luminal cell lines were loaded in the immunoblots comparing expression to basal A versus basal B tumors. (B) Immunoblot analysis of whole-cell lysates generated from mammary glands of three FVB female mice using ShcA- and tubulin-specific antibodies. (C) Quantification of p66ShcA mRNA levels in the indicated cell lines by RT-qPCR analysis. The data are normalized to GAPDH levels and are representative of results from three replicates. (D) Semiquantitative assessment of p66ShcA protein levels in breast cancer cells lines comprising the luminal and basal A and B subtypes. The data were obtained from densitometric analysis of published immunoblots (5) and are represented as the mean p66/p46 and p66/52 ratios in luminal (n = 19), basal A (n = 6), and basal B (n = 7) cell lines ± SEM (*, P = 0.036; **, P = 0.034; ***, P = 0.002). (E) Semiquantitative assessment of the mean p66/ErbB2 ratio ± SEM (*, P = 0.001; **, P < 0.001).
FIG 2
FIG 2
p66ShcA reduces the growth of ErbB2-positive luminal mammary tumors. (A) Immunohistofluorescent staining of ErbB2-driven (NIC) tumors using cytokeratin 8/18 (CK8)- and vimentin-specific antibodies. Scale bar = 30 μm. (B) Immunoblot of vector control (VC) and p66ShcA-overexpressing NIC cell lysates using ShcA- and tubulin-specific antibodies. (C) Mammary fat pad injection of NIC/VC and NIC/p66ShcA cells (1 × 10⁶). The data are recorded as mean tumor volume (mm3) ± SEM and are representative of results for 7 mice each. (D) Percentage of dihydroethidium (DHE)-positive cells present in cryosections from NIC/VC and NIC/p66ShcA mammary tumors. The data are representative of results for 40 to 46 fields (20×) and 6 tumors per cell line and are shown as mean percent DHE-positive cells/field of view (FOV) ± SEM. (E) Mammary tumors were probed with phospho-p38 MAPK-, p38 MAPK-, and tubulin-specific antibodies. The right side shows phospho-p38/p38 ratios quantified by ImageJ software. The data represent the averages from seven independent tumors per cell line ± SEM. (F) Ki67 immunohistochemical staining of paraffin-embedded sections from NIC/VC and NIC/p66ShcA mammary tumors. The data are representative of results for 7 tumors each and are depicted as percent Ki67-positive cells ± SEM. Scale bars = 40 μm. (G) Terminal deoxynucleotidyltransferase-mediated dUTP-biotin nick end labeling (TUNEL) staining of paraffin-embedded sections from vector control and p66ShcA-expressing tumors. For each section, a minimum of 20,000 nuclei were counted using Image Scope software. The data are presented as the percent TUNEL-positive cells ± SEM (n = 7 tumors each). Scale bars = 40 μm.
FIG 3
FIG 3
p66ShcA induces an EMT in luminal mammary tumors. (A) Hematoxylin and eosin (H&E)-stained sections from NIC/VC and NIC/p66ShcA mammary tumors. Scale bars = 40 μm. (B) Immunoblot analysis of NIC/VC and NIC/p66ShcA tumor lysates using E-cadherin-, vimentin-, and tubulin-specific antibodies. Lower-molecular-weight species in the vimentin blot represent proteolytic fragments. (C) RT-qPCR analysis of RNA isolated from NIC/VC or NIC/p66ShcA mammary tumors using primers specific for mesenchymal (Snail1/2, Twist1/2, and Zeb1/2) and epithelial (E-cadherin/Cdh1 and Cldn3/Cldn4/Cldn7) markers. The data are normalized to glyceraldehyde-3-phosphate dehydrogenase (GAPDH) levels ± SEM (n = 7 tumors each). (D) Paraffin-embedded sections from NIC/VC and NIC/p66ShcA mammary tumors were subjected to immunohistofluorescent staining with CK8/18-specific antibodies (green) and costained with vimentin-, CK14-, or SMA-specific antibodies (red). The data are representative of results for seven tumors each. The following numbers of 20× fields were quantified: for VC, 141 (CK8/vimentin), 140 (CK8/SMA), and 116 (CK8/CK14), and for p66ShcA, 151 (CK8/vimentin) and 141 (CK8/SMA and CK8/CK14). The data are shown as mean percent positive staining per field ± SEM. Scale bars = 40 μm.
FIG 4
FIG 4
p66ShcA is S36 phosphorylated and increases vimentin expression in ErbB2-driven luminal breast cancer cell lines. (A) Total cell lysates were generated from control and p66ShcA-expressing NIC and BT474 cells and subsequently probed with FLAG-, E-cadherin-, vimentin-, and tubulin-specific antibodies. (B) Total cell lysates were generated from control and p66ShcA-expressing NIC and BT474 cells and subsequently probed pp38 MAPK-, p38 MAPK-, pMET-, and MET-specific antibodies. (C) FLAG immunoprecipitates from control and p66ShcA overexpressing NIC and BT474 cells probed with pS36-p66ShcA- and ShcA-specific antibodies. The positive control represents the NIC/FLAG-p66ShcA overexpressing cell line stimulated with 1 mM H2O2 for 1 h prior to cell lysis. (D) FLAG immunoprecipitates from control and p66ShcA-overexpressing NIC and BT474 cells probed with pY239/240-ShcA- and ShcA-specific antibodies. The positive control represents a breast cancer cell line stably overexpressing a FLAG-tagged p46/42ShcA construct.
FIG 5
FIG 5
p66ShcA increases the migratory property of luminal breast cancer cells. (A) Control and p66ShcA-expressing NIC (A), BT474 (B), and MDA-MB-231 (C) cells were screened by Boyden chamber assays to assess cell migration and invasion. The data are representative of results for 8 inserts from two independent experiments (NIC migration, P < 0.001; NIC invasion, P = 0.004; and BT474 migration, P < 0.001). For the MDA-MB-231 cells, the data represents the averages for 6 inserts from one experiment.
FIG 6
FIG 6
p66ShcA activated Met signaling increases vimentin expression in luminal breast cancer cells. (A) Immunoblot analysis of NIC/VC and NIC/p66ShcA tumor lysates using pSMAD2/3-, SMAD2/3-, pMET, MET-, and tubulin-specific antibodies. (B) Quantification of the relative ratios of pSMAD2/3 to SMAD2/3 and pMET to MET in the mammary tumor lysates shown in panel A. (C) HGF ELISA of NIC/VC and NIC/p66ShcA tumor lysates (n = 7 tumors each). (D) Immunoblot analysis of tumor lysates from MMTV/NIC, MMTV/Met;Cre;p53+/+, and MMTV/Met;Cre;p53fl/+ transgenic mice using ShcA- and tubulin-specific antibodies. (E) Immunoblot analysis of whole-cell lysates from NIC/VC and NIC/p66ShcA breast cancer cells transfected with scrambled or Met-specific siRNAs using pMET-, E-cadherin-, vimentin-, and tubulin-specific antibodies. (F) Quantification of relative MET (*, P = 0.018; **, P = 0.005) and vimentin levels (normalized to tubulin levels) in NIC/VC and NIC/p66ShcA cells transfected with scrambled and Met-specific siRNAs as outlined for panel E. The data are representative of results from four independent experiments. (G) Immunoblot analysis of whole-cell lysates from NIC-p66ShcA breast cancer cells treated with 1 μM crizotinib or DMSO control over a 4-day period. (H) Quantification of the pMET/MET ratio (*, P = 0.04; **, P = 0.008) and relative vimentin levels (normalized to tubulin levels) in NIC/VC and NIC/p66ShcA cells treated with DMSO or crizotinib as outlined for panel G. The data are representative of results from four independent experiments.
FIG 7
FIG 7
p66ShcA levels stratify primary breast tumors with an EMT phenotype irrespective of molecular subtype. (A) Region within the CH2 domain used to interrogate p66ShcA expression levels. (B) Relative p66ShcA mRNA levels were determined from 84 primary breast cancers by RT-qPCR (Genome Quebec). We also screened p66ShcA mRNA levels in 660 primary breast cancers by RNA-seq (TCGA). Tumors were stratified based on relative p66ShcA expression levels (low, bottom 50%; high, top 50%). (C and D) Stratification of breast tumors with the Genome Quebec (C) and TCGA (D) data sets based on increasing p66ShcA expression levels. A similar analysis was performed across all subtypes within the Genome Quebec and TCGA data sets. (E) Stratification of breast tumors within the TCGA data set based on increasing ShcA levels using a probe that spans all three isoforms. A heat map depicting the relative expression levels of luminal (green) and mesenchymal (red) genes is shown. (F) Relative E-cadherin (CDH1) and vimentin (VIM) expression levels in breast cancer patients from the TCGA data set (n = 660). For each patient, fold change gene expression values were calculated by first normalizing expression levels within a tumor to the average expression value across all tumors (n = 660). Normalized expression values were then log2 transformed, and tumors were segregated into quartiles based on relative p66ShcA levels over the entire cohort. (G) Relative SNAI1, SNAI2, TWIST1, TWIST2, ZEB1, and ZEB2 gene expression levels in breast tumors from the TCGA data set as outlined in panel F.
FIG 8
FIG 8
p66ShcA is enriched in the claudin-low subtype of basal breast cancer. (A) The percentage of p66ShcA-low and p66ShcA-high tumors within each molecular subtype is shown for the Genome Quebec and TCGA data sets. (B to E) Stratification of luminal A (B), luminal B (C), HER2 (D), and basal (E) tumors within the TCGA data set based on increasing p66ShcA levels. Heat maps depicting the relative expression levels of luminal (green) and mesenchymal (red) genes are shown. (F) Tumors were ordered by increasing p66ShcA levels, and expression levels of genes within a claudin-low signature were determined (Genome Quebec). (G) For the TCGA data set, the relative percentage of p66ShcA-low and p66ShcA-high tumors that are defined as claudin low by gene expression profiling is shown. For the TCGA data set in panel A, the P values for the association between high p66ShcA levels (top 50%) between breast cancer subtypes was determined using Fisher's exact probability test and are as follows: luminal A versus luminal B, P = 0.0002; luminal A versus HER2, P = 0.00019; luminal A versus basal, P = 7.3 × 10⁻⁸; luminal B versus HER2, P = 0.64; luminal B versus basal, P = 0.07; and HER2 versus basal, P = 0.27. *, P = 0.004 (p66ShcALow versus p66ShcAHigh within the basal subtype).
FIG 9
FIG 9
Proposed model for the role of p66ShcA in promoting plasticity among the various breast cancer subtypes. Within the luminal subtype, breast tumors uniformly express cytokeratin 8/18, along with adherens (E-cadherin) and tight junctional (ZO-1 and claudin) proteins. However, a subset of these tumors also express EMT-like genes (vimentin, N-cadherin, Snai1/2, Zeb1/2, and Twist1/2) without the obligate loss of E-cadherin expression. We propose that elevated p66ShcA expression in luminal breast cancer cells endows them with such a partial EMT phenotype to increase their plasticity, leading to enhanced cell migration and invasion. In contrast, within the basal subtype, basal-like tumors coexpress luminal (CK8/18) and myoepithelial (CK14 and SMA) markers, while claudin-low tumors uniformly lack luminal epithelial markers and stably express mesenchymal genes indicative of a complete EMT. We propose that elevated p66ShcA overexpression in the basal subtype further drives an EMT to promote the development of claudin-low breast tumors.

References

    1. Perou CM, Sorlie T, Eisen MB, van de Rijn M, Jeffrey SS, Rees CA, Pollack JR, Ross DT, Johnsen H, Akslen LA, Fluge O, Pergamenschikov A, Williams C, Zhu SX, Lonning PE, Borresen-Dale AL, Brown PO, Botstein D. 2000. Molecular portraits of human breast tumours. Nature 406:747–752. 10.1038/35021093 - DOI - PubMed
    1. van de Vijver MJ, He YD, van't Veer LJ, Dai H, Hart AA, Voskuil DW, Schreiber GJ, Peterse JL, Roberts C, Marton MJ, Parrish M, Atsma D, Witteveen A, Glas A, Delahaye L, van der Velde T, Bartelink H, Rodenhuis S, Rutgers ET, Friend SH, Bernards R. 2002. A gene-expression signature as a predictor of survival in breast cancer. N. Engl. J. Med. 347:1999–2009. 10.1056/NEJMoa021967 - DOI - PubMed
    1. Visvader JE. 2009. Keeping abreast of the mammary epithelial hierarchy and breast tumorigenesis. Genes Dev. 23:2563–2577. 10.1101/gad.1849509 - DOI - PMC - PubMed
    1. Gusterson BA, Ross DT, Heath VJ, Stein T. 2005. Basal cytokeratins and their relationship to the cellular origin and functional classification of breast cancer. Breast Cancer Res. 7:143–148. 10.1186/bcr1041 - DOI - PMC - PubMed
    1. Neve RM, Chin K, Fridlyand J, Yeh J, Baehner FL, Fevr T, Clark L, Bayani N, Coppe JP, Tong F, Speed T, Spellman PT, DeVries S, Lapuk A, Wang NJ, Kuo WL, Stilwell JL, Pinkel D, Albertson DG, Waldman FM, McCormick F, Dickson RB, Johnson MD, Lippman M, Ethier S, Gazdar A, Gray JW. 2006. A collection of breast cancer cell lines for the study of functionally distinct cancer subtypes. Cancer Cell 10:515–527. 10.1016/j.ccr.2006.10.008 - DOI - PMC - PubMed

Publication types

Substances