. 2014 Aug 12;111(32):E3260-8.
doi: 10.1073/pnas.1319176111. Epub 2014 Jul 28.

CRTC1/MAML2 gain-of-function interactions with MYC create a gene signature predictive of cancers with CREB-MYC involvement

Affiliations

CRTC1/MAML2 gain-of-function interactions with MYC create a gene signature predictive of cancers with CREB-MYC involvement

Antonio L Amelio et al. Proc Natl Acad Sci U S A. .

Abstract

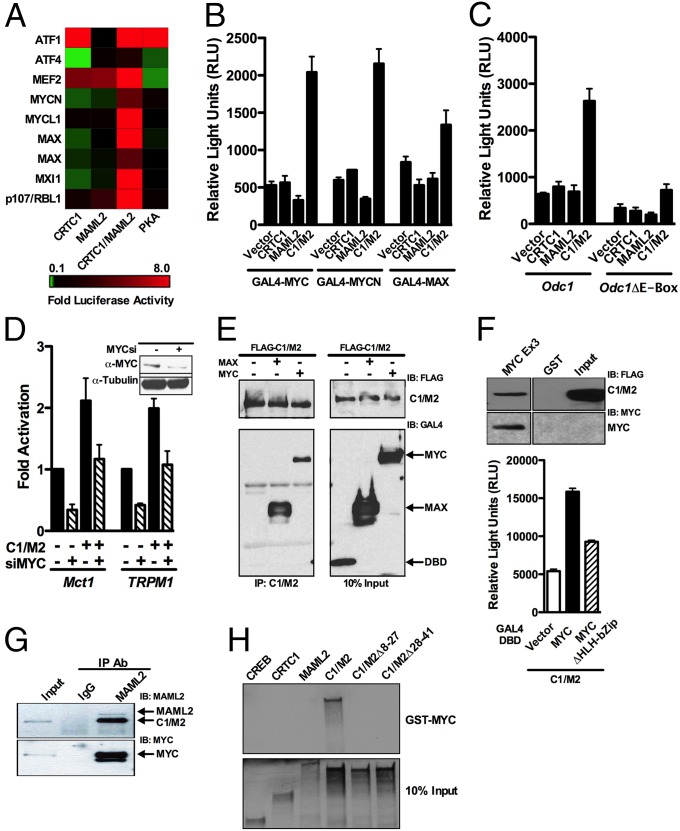
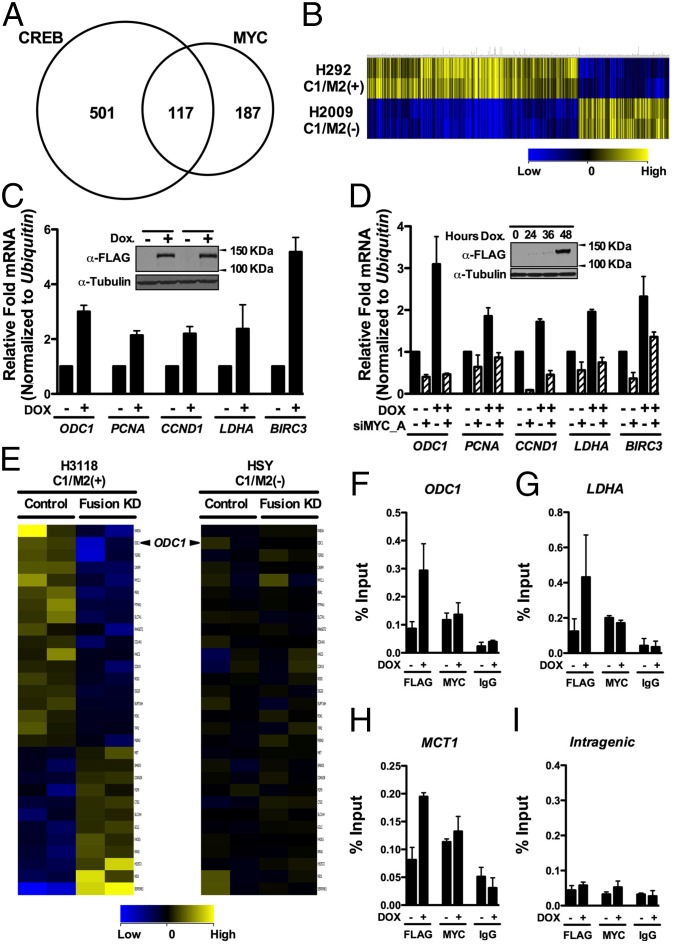
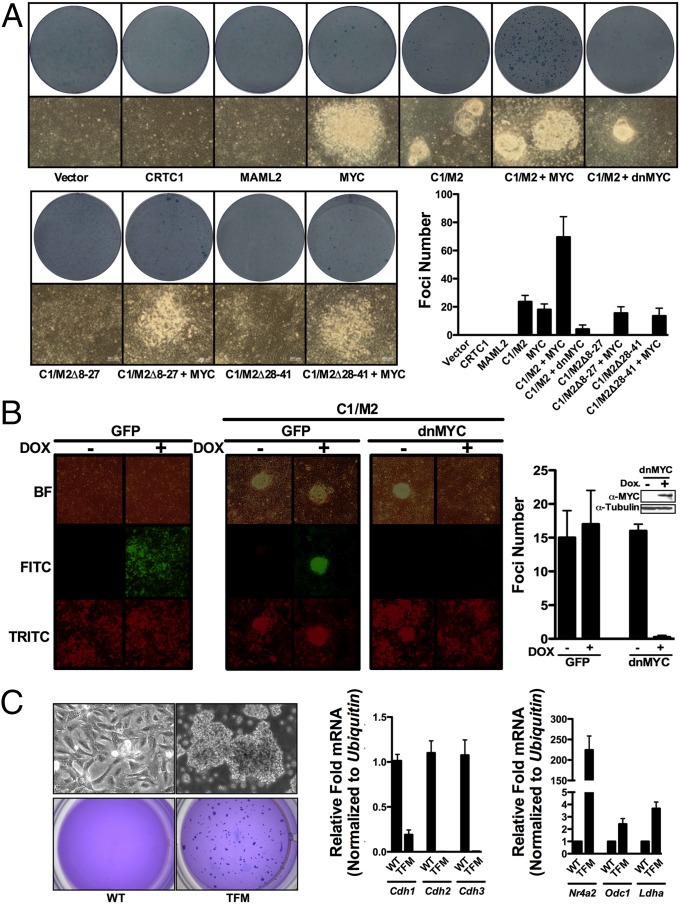
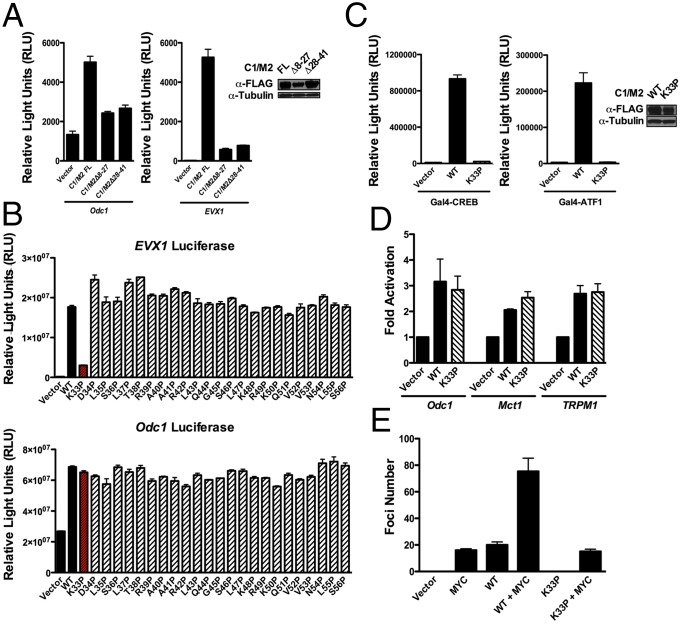
Chimeric oncoproteins created by chromosomal translocations are among the most common genetic mutations associated with tumorigenesis. Malignant mucoepidermoid salivary gland tumors, as well as a growing number of solid epithelial-derived tumors, can arise from a recurrent t (11, 19)(q21;p13.1) translocation that generates an unusual chimeric cAMP response element binding protein (CREB)-regulated transcriptional coactivator 1 (CRTC1)/mastermind-like 2 (MAML2) (C1/M2) oncoprotein comprised of two transcriptional coactivators, the CRTC1 and the NOTCH/RBPJ coactivator MAML2. Accordingly, the C1/M2 oncoprotein induces aberrant expression of CREB and NOTCH target genes. Surprisingly, here we report a gain-of-function activity of the C1/M2 oncoprotein that directs its interactions with myelocytomatosis oncogene (MYC) proteins and the activation of MYC transcription targets, including those involved in cell growth and metabolism, survival, and tumorigenesis. These results were validated in human mucoepidermoid tumor cells that harbor the t (11, 19)(q21;p13.1) translocation and express the C1/M2 oncoprotein. Notably, the C1/M2-MYC interaction is necessary for C1/M2-driven cell transformation, and the C1/M2 transcriptional signature predicts other human malignancies having combined involvement of MYC and CREB. These findings suggest that such gain-of-function properties may also be manifest in other oncoprotein fusions found in human cancer and that agents targeting the C1/M2-MYC interface represent an attractive strategy for the development of effective and safe anticancer therapeutics in tumors harboring the t (11, 19) translocation.


Conflict of interest statement

The authors declare no conflict of interest.

Figures

Fig. 1.
Fig. 1.
The C1/M2 chimeric oncoprotein selectively coactivates the MYC network. (A) Heat map of screen data displaying luciferase reporter activation (red) and repression (green). GAL4–DBD library proteins are along the y axis, with coexpressed C1/M2 and controls along the x axis. (B) HEK293T cells were transiently cotransfected with CRTC1, MAML2, C1/M2, or empty expression vectors, and GAL4–DBD library proteins and the 5×GAL4::UAS-luciferase reporter and luciferase assays were performed 24 h posttransfection (n = 4; mean ± SEM). (C) Odc1 or Odc1ΔE-Box luciferase reporters were cotransfected in NIH 3T3 cells with CRTC1, MAML2, C1/M2, or empty expression vectors, and luciferase assays were performed 24 h posttransfection (n = 3; mean ± SEM). (D) Transient cotransfections of HEK293T cells were performed with MYC (MYCsi_A) or nonspecific siRNAs and the indicated E-Box–containing luciferase reporters, and luciferase assays were performed 72 h posttransfection (n = 4; mean ± SEM). (Inset) Western blot analysis demonstrated efficient knockdown of MYC with MYCsi_A. (E) Co-IP with FLAG-tagged C1/M2 and GAL4–MAX or GAL4–MYC was performed in transiently transfected HEK293T cells. Whole-cell lysates were immunoprecipitated using anti-FLAG–M2 magnetic beads followed by Western blot analysis with anti-FLAG or anti-GAL4–DBD antibodies. As a negative control, empty GAL4–DBD vector was cotransfected with FLAG–C1/M2. (F) C1/M2 interacts with MYC via its bHLH-Zip domain. GST pull-down assay using FLAG–C1/M2 lysates incubated with immobilized GST or GST–MYC Exon3 encompassing the bHLH-Zip domain (Upper Left). Binding of C1/M2 was analyzed by Western blotting with a FLAG antibody. HEK293T cells were transiently cotransfected with C1/M2, GAL4–DBD vector, or GAL4–DBD MYC proteins, and the 5×GAL4::UAS-luciferase reporter and luciferase assays were performed 24 h posttransfection (Upper Right). (G) Co-IP of endogenous C1/M2 with endogenous c-MYC from human H3118 MEC tumor cells that harbor the t (11, 19) translocation. Immunoprecipitation of C1/M2 was performed using a MAML2 antibody followed by Western blotting with anti-MAML2 or anti–c-MYC antibodies. (H) GST pull-down assay with full-length GST–MYC incubated with 35S-labeled, in vitro translated CREB, CRTC1, MAML2, C1/M2, C1/MΔ8–27, or C1/MΔ28–41. Shown are 10% input labeled polypeptides.
Fig. 2.
Fig. 2.
MYC target genes are regulated by the C1/M2 oncoprotein. (A) RNA-seq analysis of genes regulated by a stably integrated, Dox-inducible C1/M2 transgene in FLP-In T-Rex HEK293 cells (HEK293-CMVTetRTetOC1/M2) reveals that C1/M2 regulates genes of the CRTC:CREB and MYC:MAX networks. A Venn diagram is shown, with values representing the number of differentially regulated genes that are direct CREB and/or direct MYC targets. In total, 187 genes induced by C1/M2 were scored as direct MYC targets. (B) Hierarchical clustering of differentially expressed C1/M2-regulated CREB–MYC signature genes in H292 MEC (C1/M2+) versus H2009 non-MEC tumor cells. guanine cytosine robust multi-array analysis (GCRMA) quantile normalization was applied to the raw CEL files for two biological replicates from H2009 and H292 MEC cell line samples with baseline transformation set to the median of all samples. (C) Real-time qPCR analysis of endogenous MYC target genes in HEK293-CMVTetRTetOC1/M2 cells +/− Dox. Fold induction is shown; expression was normalized to Ubiquitin mRNA levels (n = 4). (Inset) Western blot analysis of C1/M2 levels following Dox treatment in independently derived stable cell clones. (D) Knockdown of MYC (siMYC_A) blocks the induction of Myc target genes by C1/M2 in double stable TRE-Tight-C1/M2 Tet-On Advanced A549 NSCLC lung cancer cells (A549-CMVrtTA2-M2TRE-TightC1/M2 cells). These cells were transfected with siMYC_A or nonspecific siRNAs (NSsi; −siMYC lanes) and then were treated +/− Dox for 48 h, and expression of MYC targets was assessed by real-time qPCR. The fold induction relative to nonspecific silencing RNA (NSsi) no Dox treatment is shown, and data were normalized to Ubiquitin mRNA levels (n = 4). (Inset) Western blot analysis of C1/M2 levels following Dox treatment. (E) Gene expression profiling of the C1/M2-regulated MYC signature genes in H3118 MEC tumor cells that harbor the t (11, 19) translocation and express C1/M2 compared with HSY tumor cells that lack the translocation and do not express C1/M2 following lentiviral-mediated delivery of C1/M2 (Fusion KD) or control shRNAs (n = 2 biological replicates). (F–I) C1/M2 is recruited to endogenous MYC-responsive promoters. Chromatin from HEK293-CMVTetRTetOC1/M2 cells +/− Dox (48 h) was immunoprecipitated with α-FLAG or α-MYC antisera, or with isotype-matched normal IgG, and analyzed for occupancy of the promoter-regulatory regions of the (F) ODC1, (G) LDHA, and (H) MCT1 genes relative to occupancy of a nonspecific (I) intragenic region of CCNB1 (84). Real-time qPCR quantification of C1/M2 and MYC occupancy is expressed as percent chromatin precipitated relative to input (n = 4). Data in C and D as well as F–I represent mean ± SEM.
Fig. 3.
Fig. 3.
MYC is necessary for CTRC1/MAML2-directed transformation of epithelial cells. (A) Rat kidney epithelial cells (RK3E) were transfected with the indicated expression plasmids, plated, grown for 3 wk, and then fixed with methanol and stained with methylene blue to quantify foci formation. Representative images of foci morphology before staining (bottom photographs) along with wells after staining (Lower photographs) and quantitation of observed foci numbers are shown (n = 3). (B) TRE-Tight-C1/M2 Tet-On Advanced RK3E cells expressing Dox-inducible GFP (RK3E-CMVrtTA2-M2TRE-TightGFP-PGKtdTomato) or In373-dnMYC (RK3E-CMVrtTA2-M2TRE-TightdnMYC-PGKtdTomato) were assessed for foci formation following the induction of C1/M2 by Dox treatment. RK3E cells engineered to inducibly express GFP were allowed to form monolayers and then treated with Dox or vehicle for 72 h and imaged (Left). RK3E cells engineered to inducibly express GFP or In373-dnMYC were transfected with C1/M2, allowed to form monolayers, and then were treated with Dox or vehicle, and foci formation imaged and quantitated at 3 wk posttransfection (Right) (n = 2). (C) Myc augments the transforming potential of C1/M2 in primary RK3E cells. (Upper) Phase contrast of parental RK3E cells (WT) or RK3E transformed by C1/M2 plus MYC (TFM). (Lower) Colony formation in soft agar was assessed for RK3E WT or TFM cells. A total of 5 × 10³ cells were plated in 0.7% agar medium over agar underlayers. At 3 wk plates were stained with crystal violet to quantify colony numbers and were photographed. (Right) Real-time qPCR analysis of Cdh1-3, Nr4a2, Odc1, or Ldha levels in parental RK3E cells (WT) or in cells transformed with C1/M2 plus Myc (TFM). Fold changes are expressed relative to WT, and data are normalized to Ubiquitin mRNA levels (n = 4). Data in A–C represent mean ± SEM.
Fig. 4.
Fig. 4.
Coactivation of CREB and MYC by C1/M2 is functionally separable. (A) NIH 3T3 cells were transiently transfected with Odc1 or EVX1 luciferase reporters along with C1/M2, C1/M2Δ8–27, C1/M2Δ28–41, or empty expression vector, and luciferase assays were performed 24 h posttransfection (n = 4). (B) Functional screen for site-directed mutants that can discriminate between CREB and MYC transcription factor targets. Transient assays of EVX1-luciferase or Odc1-luciferase reporters in HEK293T cells cotransfected with wild-type (WT) C1/M2 versus the library of C1/M2 proline point mutants (n = 4). (C) Effect of wild-type (WT) C1/M2 versus proline point mutant (C1/M2-K33P) in a transient assay of 5×GAL4::UAS-luciferase reporter in HEK293T cells cotransfected with GAL4–CREB or GAL4–ATF1 (n = 3). (Inset) Western blot analysis of C1/M2 WT and K33P mutant expression levels. (D) HEK293T cells were cotransfected with WT C1/M2 or the C1/M2-K33P mutant and the indicated MYC-responsive luciferase reporters (n = 4). (E) Quantitation of observed foci numbers in RK3E focus assays comparing C1/M2 WT and C1/M2-K33P (n = 2). Data in A–E represent mean ± SEM.
Fig. 5.
Fig. 5.
The C1/M2 gene signature predicts human malignancies with dual activation of MYC and CREB transcription networks. (A) Western blot analysis reveals increased MYC levels in several human esophageal cancer cell lines relative to immortal normal esophageal Het1A epithelial cells. (B) Hierarchical clustering of differentially expressed C1/M2-regulated CREB–MYC signature genes from multiple esophageal (n = 16) tumor samples based on an inverse correlation between MYC and LKB1 expression levels. The esophageal samples (75 total samples) were log2 normalized, the baseline transformation was set to the median of all samples, and then samples were divided into two groups relative to median MYC and LKB1 signals: HighMYC–LowLKB1 (eight samples) and LowMYC–HighLKB1 (eight samples). (C) Hierarchical clustering based solely on the presence of differentially expressed C1/M2-regulated CREB–MYC signature genes in lung adenocarcinoma and squamous cell carcinoma tumor samples. GCRMA quantile normalization was applied to the raw CEL files (58 total) for 40 lung adenocarcinoma and 18 squamous cell carcinoma samples, with baseline transformation set to the median of all samples. (D) Hierarchical clustering of differentially expressed C1/M2-regulated CREB–MYC signature genes from multiple lung adenocarcinoma samples (n = 51) based on an inverse correlation between MYC and LKB1 expression levels. GCRMA quantile normalization was applied to the raw CEL files (462 total), with baseline transformation set to the median of all samples. A total of 51 samples (either HighMYC–LowLKB1 or LowMYC–HighLKB1) were selected for further analysis based on identification of top (high) and bottom (low) quartile samples. Data in B–D represent fold change greater than 1.5 (P < 0.05).

References

    1. Hanahan D, Weinberg RA. The hallmarks of cancer. Cell. 2000;100(1):57–70. - PubMed
    1. Hanahan D, Weinberg RA. Hallmarks of cancer: The next generation. Cell. 2011;144(5):646–674. - PubMed
    1. Vogelstein B, Kinzler KW. Cancer genes and the pathways they control. Nat Med. 2004;10(8):789–799. - PubMed
    1. Mitelman F, Johansson B, Mertens F. The impact of translocations and gene fusions on cancer causation. Nat Rev Cancer. 2007;7(4):233–245. - PubMed
    1. Rabbitts TH. Commonality but diversity in cancer gene fusions. Cell. 2009;137(3):391–395. - PubMed

Publication types

MeSH terms

LinkOut - more resources