. 2014 Sep 2;111(35):12877-82.
doi: 10.1073/pnas.1407461111. Epub 2014 Jul 28.

Bacillus subtilis chromosome organization oscillates between two distinct patterns

Affiliations

Bacillus subtilis chromosome organization oscillates between two distinct patterns

Xindan Wang et al. Proc Natl Acad Sci U S A. .

Abstract

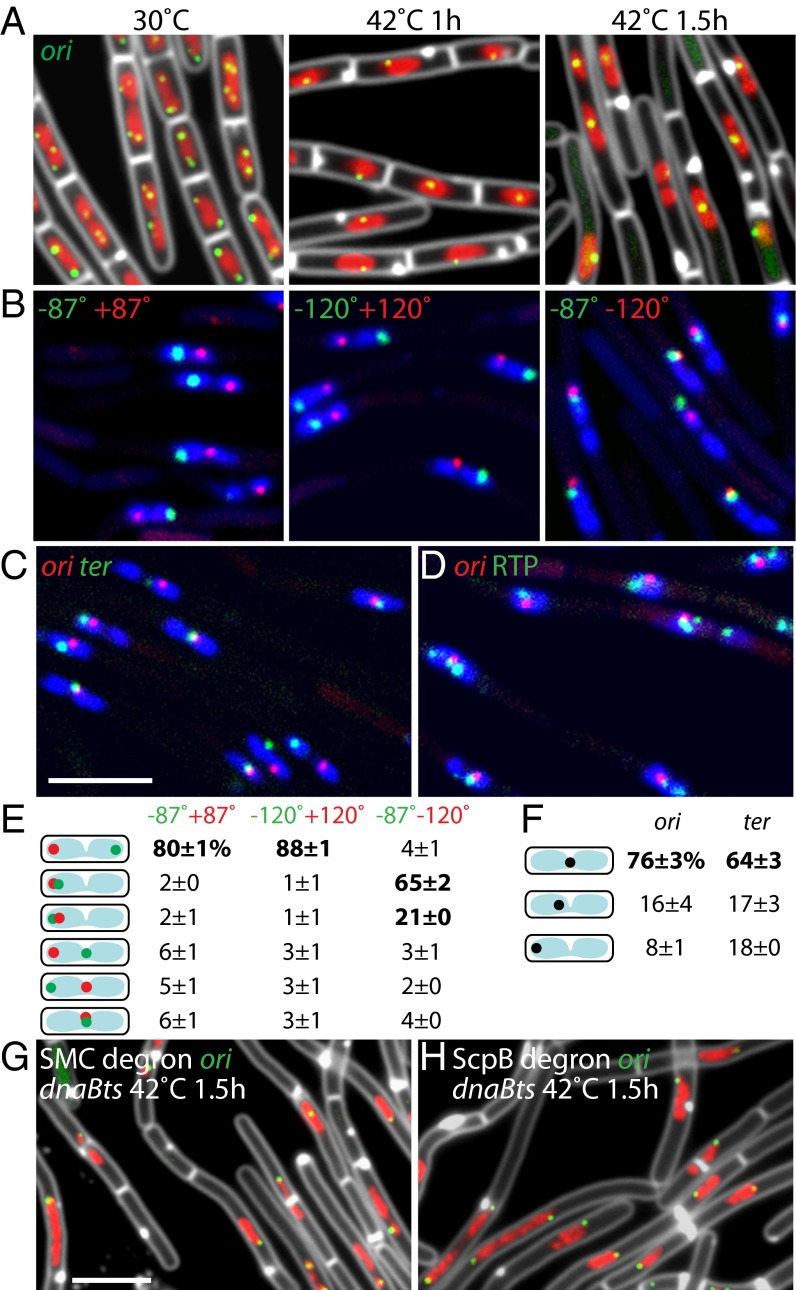
Bacterial chromosomes have been found to possess one of two distinct patterns of spatial organization. In the first, called "ori-ter" and exemplified by Caulobacter crescentus, the chromosome arms lie side-by-side, with the replication origin and terminus at opposite cell poles. In the second, observed in slow-growing Escherichia coli ("left-ori-right"), the two chromosome arms reside in separate cell halves, on either side of a centrally located origin. These two patterns, rotated 90° relative to each other, appear to result from different segregation mechanisms. Here, we show that the Bacillus subtilis chromosome alternates between them. For most of the cell cycle, newly replicated origins are maintained at opposite poles with chromosome arms adjacent to each other, in an ori-ter configuration. Shortly after replication initiation, the duplicated origins move as a unit to midcell and the two unreplicated arms resolve into opposite cell halves, generating a left-ori-right pattern. The origins are then actively segregated toward opposite poles, resetting the cycle. Our data suggest that the condensin complex and the parABS partitioning system are the principal driving forces underlying this oscillatory cycle. We propose that the distinct organization patterns observed for bacterial chromosomes reflect a common organization-segregation mechanism, and that simple modifications to it underlie the unique patterns observed in different species.

Keywords: DNA replication; ParA; SMC condensin; chromosome segregation.


Conflict of interest statement

The authors declare no conflict of interest.

Figures

Fig. 1.
Fig. 1.
Chromosome organization during sporulation. (AE) Exponentially growing cells were induced to sporulate and imaged after 2 h. All strains contained a mutation in spoIIIE (spoIIIE36) (55) to prevent DNA transport. (A) Chromosome map showing positions of operator arrays. (B) Schematic summary of cellular localization of loci. Representative micrographs of cells labeled with pairs of loci ori-ter (C, Left), ±87° (D, Left), and ±120° (E, Left) are shown. (CE, Right) Loci position relative to cell length analyzed (Materials and Methods). The centroid of the Gaussian distribution is shown on the top of each histogram. (F and G) Origin number and localization in rich and poor growth media. Origins (green, tetO48/TetR-CFP), nucleoid (blue, HBsu-mYpet), and membrane [red, N-(3-triethylammoniumpropyl)-4-(6-(4-(diethylamino) phenyl) hexatrienyl), pyridinium dibromide (FM4-64)] are shown. (Scale bar: 4 μm.)
Fig. 2.
Fig. 2.
Left-ori-right organization in cells with a single chromosome. Cells with a dnaB(ts) mutation were shifted from 30 °C to 42 °C for 1.5 h to block new rounds of initiation. (A) Origin localization before and after temperature shift. Origins (green), nucleoid (red), and membrane (white) are shown. (B) Representative micrographs of cells labeled at pairs of loci: ±87° (Left), ±120° (Center), and −87° and −120° (Right). (C) Cells labeled at ori (red) and ter (green). (D) Cells labeled at ori (red) and expressing RTP-YFP (green). (E and F) Quantitative analysis of loci positions. Origin localization in dnaB(ts) 1.5 h after temperature shift and degradation of SMC (G) or ScpB (H) is shown. (Scale bars: 4 μm.)
Fig. 3.
Fig. 3.
Alternating patterns of chromosome organization during the cell cycle. (A) Time-lapse progression (5-min intervals) of cells labeled at the origin (green) and nucleoid (red) grown in minimal medium supplemented with sorbitol. Red carets highlight replication initiation at the edge of the nucleoid. Yellow carets show duplicated origins at the center of the nucleoid before their segregation. (B) Time-lapse progression (10-min intervals) of cells labeled at −87° (green) and +87° (red). Black arrows highlight resolution of the left and right loci. (C) Representative micrograph of cells labeled at three chromosomal loci: origin (blue, mCherry-Spo0J), −87° (green), and +87° (red). Stages in the replication–segregation cycle are indicated (I–III) and are interpreted in the schematic model (Right). Origin, −87°, and +87° loci are labeled as blue, green, and red balls, respectively. Chromosome arms are shown as gray lines. (Scale bar: 4 μm.)
Fig. 4.
Fig. 4.
Schematic model of the organization–segregation cycle in B. subtilis, and its comparison with C. crescentus and E. coli. Origins are represented as black balls, and termini are represented as brown lines in B. subtilis and E. coli and as a brown oval in C. crescentus. The compacted left and right chromosome arms are shown as thick blue and purple lines (or blobs). Newly replicated DNA is shown with a lighter hue, whereas uncompacted DNA is shown as thin lines. In the B. subtilis, newborn cell, unreplicated DNA is shown as a black cloud. The replication–segregation cycle of C. crescentus and E. coli corresponds to two halves of the cycle in B. subtilis.
Fig. 5.
Fig. 5.
Impaired origin segregation and chromosome arm dynamics in the absence of Soj (ParA). (A) Time-lapse progression (5-min intervals) of ∆soj cells. The origin (green) and nucleoid (red) are shown. Representative origin traces in WT (B) and ∆soj (C) are shown. The position of the origin was plotted relative to the total cell length (Fig. S8). (D) Interfocal distances of ±87° loci are analyzed in representative WT (Upper) and ∆soj (Lower) cells in time-lapse progressions (10-min intervals). Each graph plots the distance between a pair of ±87° loci relative to the cell length (L) at indicated times during their replication cycle. For the purpose of this analysis, the replication cycle of these loci begins when both ±87° loci are replicated (defined as frame 1) and finishes when either of the two loci is replicated again. Because each cell has two pairs of ±87° loci in its replication cycle, the maximum distance of a pair of ±87° loci is 50% of the cell length (Fig. S10).

Comment in

References

    1. Reyes-Lamothe R, Nicolas E, Sherratt DJ. Chromosome replication and segregation in bacteria. Annu Rev Genet. 2012;46:121–143. - PubMed
    1. Wang X, Montero Llopis P, Rudner DZ. Organization and segregation of bacterial chromosomes. Nat Rev Genet. 2013;14(3):191–203. - PMC - PubMed
    1. Viollier PH, et al. Rapid and sequential movement of individual chromosomal loci to specific subcellular locations during bacterial DNA replication. Proc Natl Acad Sci USA. 2004;101(25):9257–9262. - PMC - PubMed
    1. Fogel MA, Waldor MK. Distinct segregation dynamics of the two Vibrio cholerae chromosomes. Mol Microbiol. 2005;55(1):125–136. - PubMed
    1. Fogel MA, Waldor MK. A dynamic, mitotic-like mechanism for bacterial chromosome segregation. Genes Dev. 2006;20(23):3269–3282. - PMC - PubMed

Publication types

MeSH terms

LinkOut - more resources