. 2014 Jul 4:8:188.
doi: 10.3389/fnins.2014.00188. eCollection 2014.

Single-sided deafness and directional hearing: contribution of spectral cues and high-frequency hearing loss in the hearing ear

Affiliations

Single-sided deafness and directional hearing: contribution of spectral cues and high-frequency hearing loss in the hearing ear

Martijn J H Agterberg et al. Front Neurosci. .

Abstract

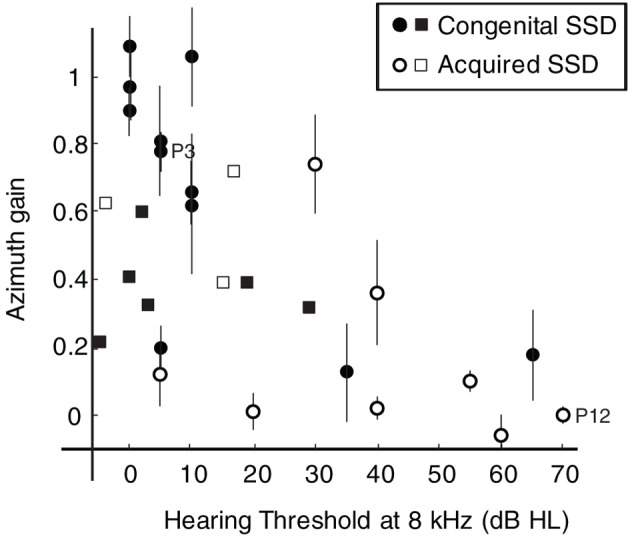
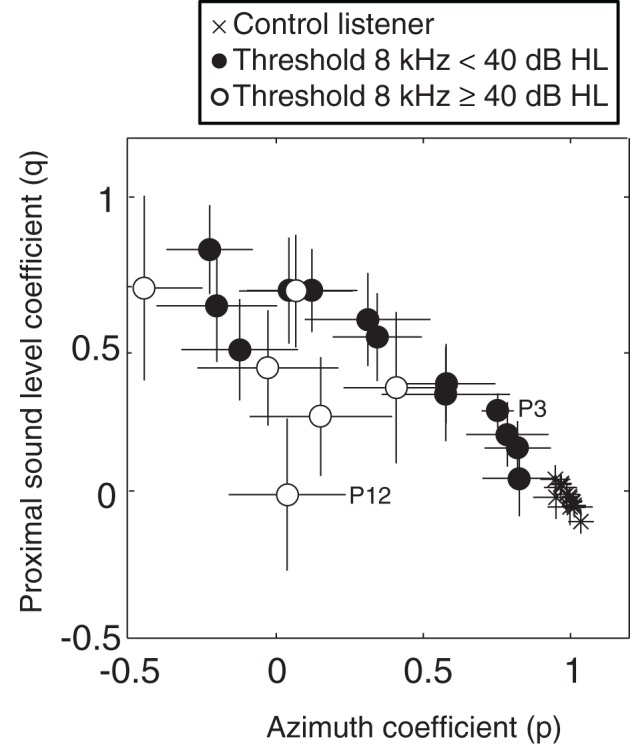
Direction-specific interactions of sound waves with the head, torso, and pinna provide unique spectral-shape cues that are used for the localization of sounds in the vertical plane, whereas horizontal sound localization is based primarily on the processing of binaural acoustic differences in arrival time (interaural time differences, or ITDs) and sound level (interaural level differences, or ILDs). Because the binaural sound-localization cues are absent in listeners with total single-sided deafness (SSD), their ability to localize sound is heavily impaired. However, some studies have reported that SSD listeners are able, to some extent, to localize sound sources in azimuth, although the underlying mechanisms used for localization are unclear. To investigate whether SSD listeners rely on monaural pinna-induced spectral-shape cues of their hearing ear for directional hearing, we investigated localization performance for low-pass filtered (LP, <1.5 kHz), high-pass filtered (HP, >3kHz), and broadband (BB, 0.5-20 kHz) noises in the two-dimensional frontal hemifield. We tested whether localization performance of SSD listeners further deteriorated when the pinna cavities of their hearing ear were filled with a mold that disrupted their spectral-shape cues. To remove the potential use of perceived sound level as an invalid azimuth cue, we randomly varied stimulus presentation levels over a broad range (45-65 dB SPL). Several listeners with SSD could localize HP and BB sound sources in the horizontal plane, but inter-subject variability was considerable. Localization performance of these listeners strongly reduced after diminishing of their spectral pinna-cues. We further show that inter-subject variability of SSD can be explained to a large extent by the severity of high-frequency hearing loss in their hearing ear.

Keywords: azimuth; head-shadow effect; mold; single-sided deaf(ness); spectral pinna-cues.


Figures

Figure 1
Figure 1
Sound-localization responses for SSD listener with a thresholds at 8 kHz < 40 dB HL (P3), a SSD listener with a thresholds at 8 kHz ≥ 40 dB HL (P12) and a control listener (C1). Responses are plotted for the BB, HP, and LP stimuli in azimuth (A) and elevation (B). The dashed gray line denotes the linear regression fit. Note the high degree of variation in monaural localization abilities of the listeners with SSD. Listener P3 had fairly good localization of BB and HP stimuli. r2, coefficient of determination, g, response gain, b, bias.
Figure 2
Figure 2
Azimuth stimulus-response relationships for BB, LP, and HP noise burst pooled for SSD listeners with 8 kHz thresholds below 40 dB HL (left hand column), SSD listeners with 8 kHz thresholds higher than 40 dB HL (middle column), and control listeners (right hand column). Black bold lines denote best-fit regression lines over the pooled data. Grayscale and size of the data points indicates the number of responses on that location. Black indicates a larger number of responses than white.
Figure 3
Figure 3
Elevation stimulus-response relationships for BB and HP noise burst pooled for SSD listeners with 8 kHz thresholds below 40 dB HL (left hand column), SSD listeners with 8 kHz thresholds higher than 40 dB HL (middle column) and control listeners (n = 13, right hand column). Black bold lines denote best-fit regression lines over the pooled data. Grayscale and size of the data points indicates the number of responses on that location. Black indicates a larger number of responses than white.
Figure 4
Figure 4
Response elevation gain for BB stimuli plotted against the azimuth gain. Data from all control listeners (gray crosses), listeners with SSD with 8 kHz thresholds below 40 dB HL (filled circles) and SSD listeners with 8 kHz thresholds higher than 40 dB HL (open circles) are presented when spectral-shape cues were available (A), and when spectral-shape cues were reduced by molds (B). Error bars denote ± 1 SE of the azimuth and elevation regression coefficients. Data points from the two SSD listeners depicted in Figure 1 (P3 and P12), are indicated in the figure. Data are pooled across presentation levels. Note the two clear outliers in the control group. These two listeners demonstrated bilateral high-frequency hearing loss (8 kHz thresholds higher than 40 dB HL).
Figure 5
Figure 5
Response azimuth gain for BB stimuli plotted against the hearing threshold at 8 kHz for listeners with congenital SSD (filled circles) and listeners with acquired SSD (open circles). Error bars denote ± 1 SE of the azimuth regression coefficient. Data points from SSD listeners P3 and P12 are emphasized in the figure. For comparison data (squares) of nine listeners with SSD from a study performed by Van Wanrooij and Van Opstal (2004) are plotted in the figure.
Figure 6
Figure 6
Multiple linear regression analysis of azimuth localization performance for BB stimuli of SSD listeners with 8 kHz thresholds below 40 dB HL (filled circles), SSD listeners with 8 kHz thresholds higher than 40 dB HL (open circles) and control listeners (crosses). The coefficients for proximal sound level (q in Equation 2) and azimuth (p in Equation 2) are plotted against one another for each listener. Error bars denote ± 1 SD of the azimuth and intensity regression coefficients, respectively. Data points from SSD listeners P3 and P12 are emphasized in the figure. For clarity, some data points are slightly shifted.

References

    1. Agterberg M. J., Snik A. F., Hol M. K., Van Wanrooij M. M., Van Opstal A. J. (2012). Contribution of monaural and binaural cues to sound localization in patients with unilateral conductive hearing loss; improved directional hearing with a bone-conduction device. Hear. Res. 286, 9–18 10.1016/j.heares.2012.02.012 - DOI - PubMed
    1. Andéol G., Macpherson E. A., Sabin A. T. (2013). Sound localization in noise and sensitivity to spectral shape. Hear. Res. 304, 20–27 10.1016/j.heares.2013.06.001 - DOI - PubMed
    1. Arndt S., Aschendorff A., Laszig R., Beck R., Schild C., Kroeger S., et al. (2011). Comparison of pseudobinaural hearing to real binaural hearing rehabilitation after cochlear implantation in patients with unilateral deafness and tinnitus. Otol. Neurotol. 32, 39–47 10.1097/MAO.0b013e3181fcf271 - DOI - PubMed
    1. Arnoldner C., Lin V. Y. (2013). Expanded selection criteria in adult cochlear implantation. Cochlear Implants Int. 14(Suppl. 4), 10–13 10.1179/1467010013Z.000000000123 - DOI - PubMed
    1. Batteau D. W. (1967). The role of the pinna in human localization. Proc. R. Soc. Lond. B Biol. Sci. 168, 158–180 10.1098/rspb.1967.0058 - DOI - PubMed