. 2014 Jun 17;5(7):2262-84.
doi: 10.1364/BOE.5.002262. eCollection 2014 Jul 1.

Adaptive optics optical coherence tomography with dynamic retinal tracking

Affiliations

Adaptive optics optical coherence tomography with dynamic retinal tracking

Omer P Kocaoglu et al. Biomed Opt Express. .

Abstract

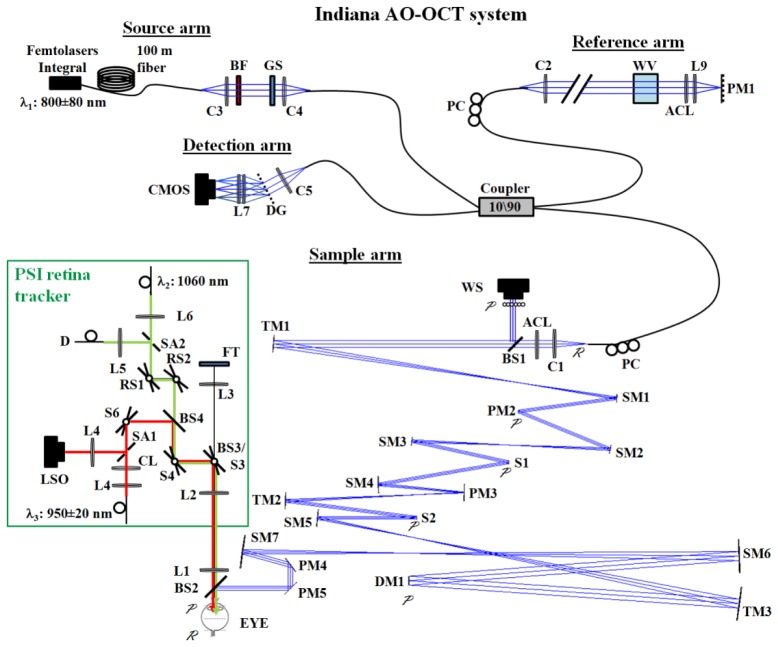
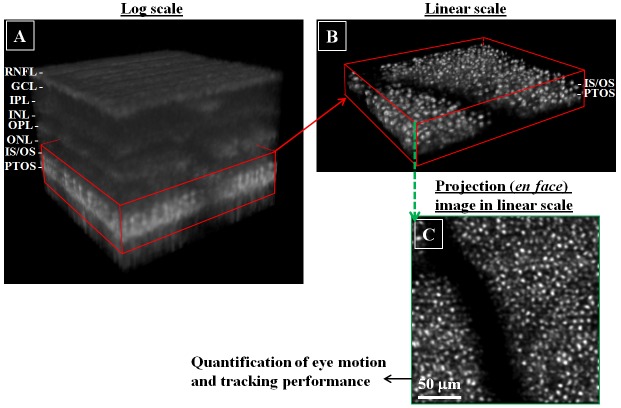
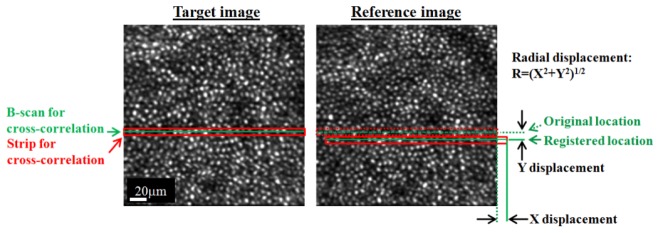
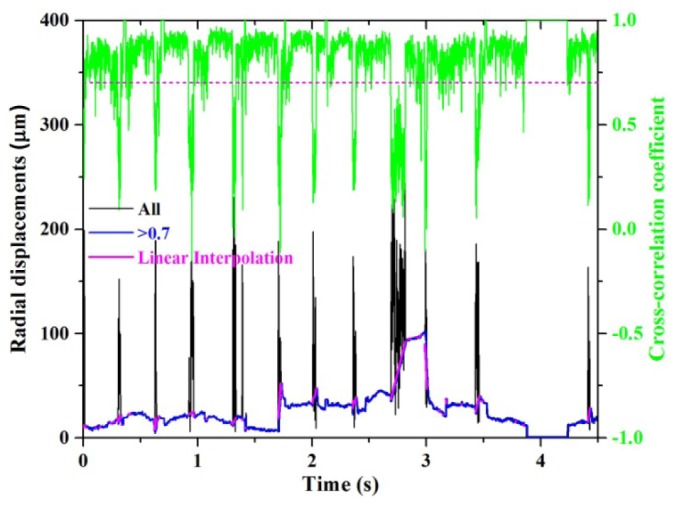
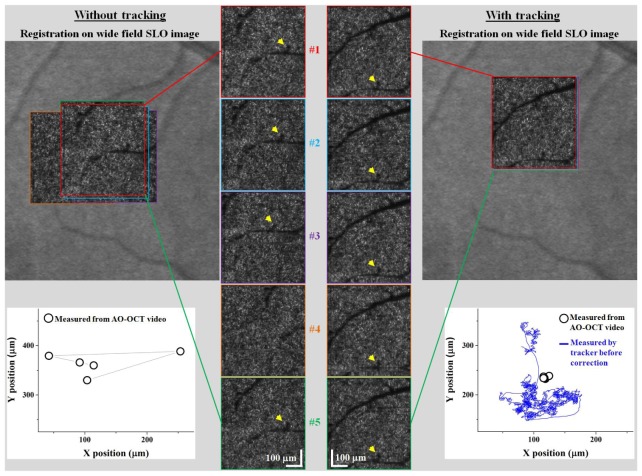
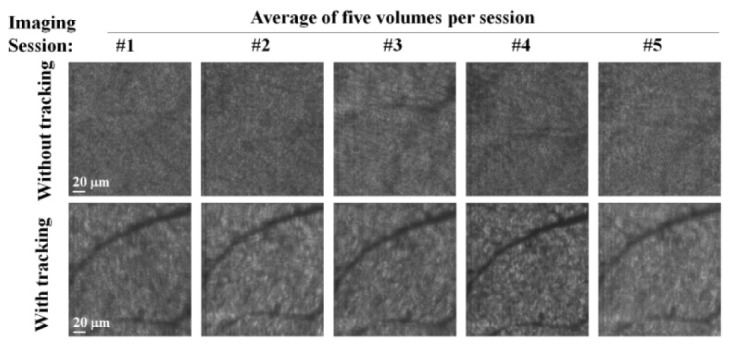
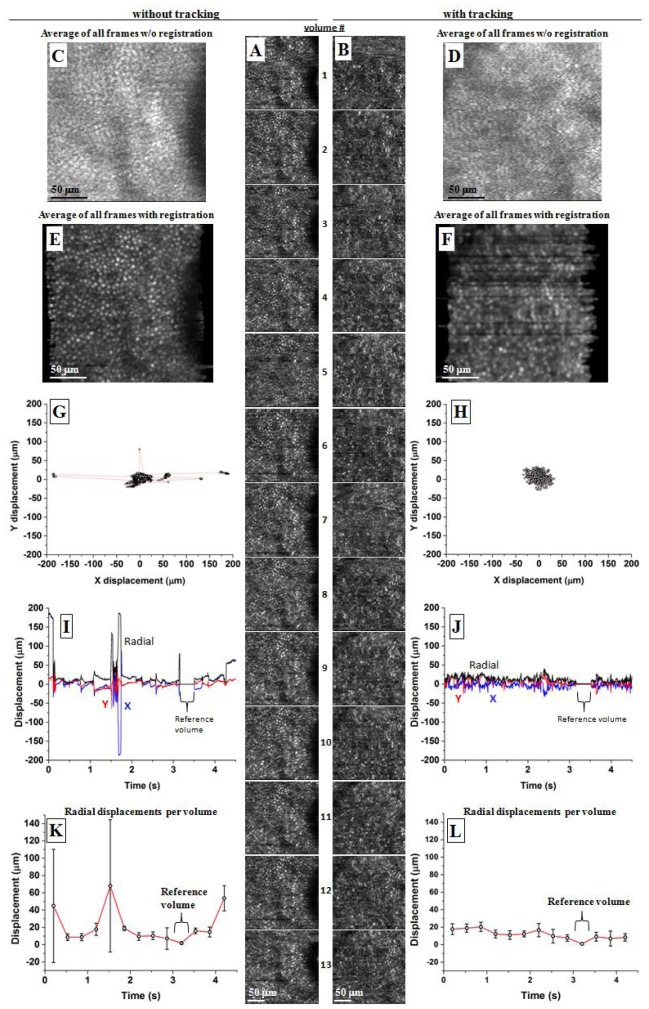
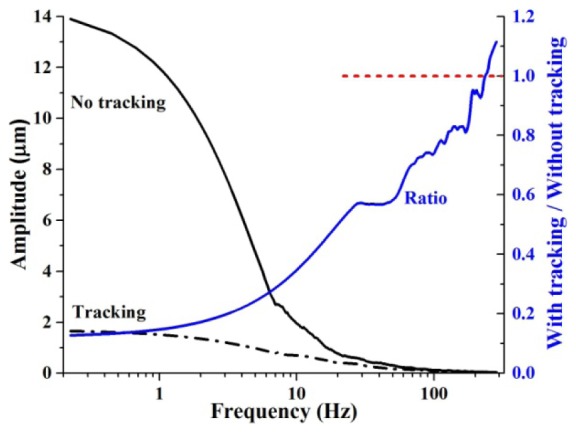
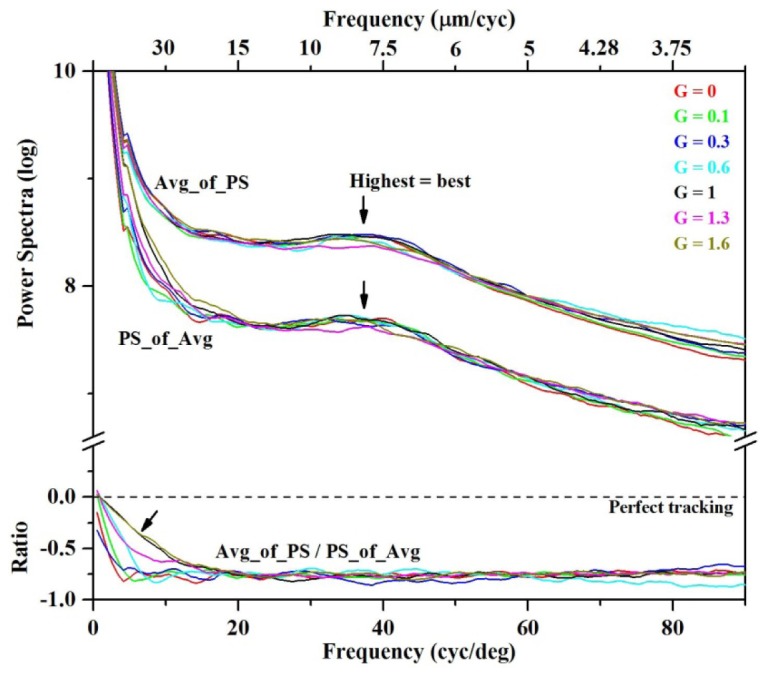
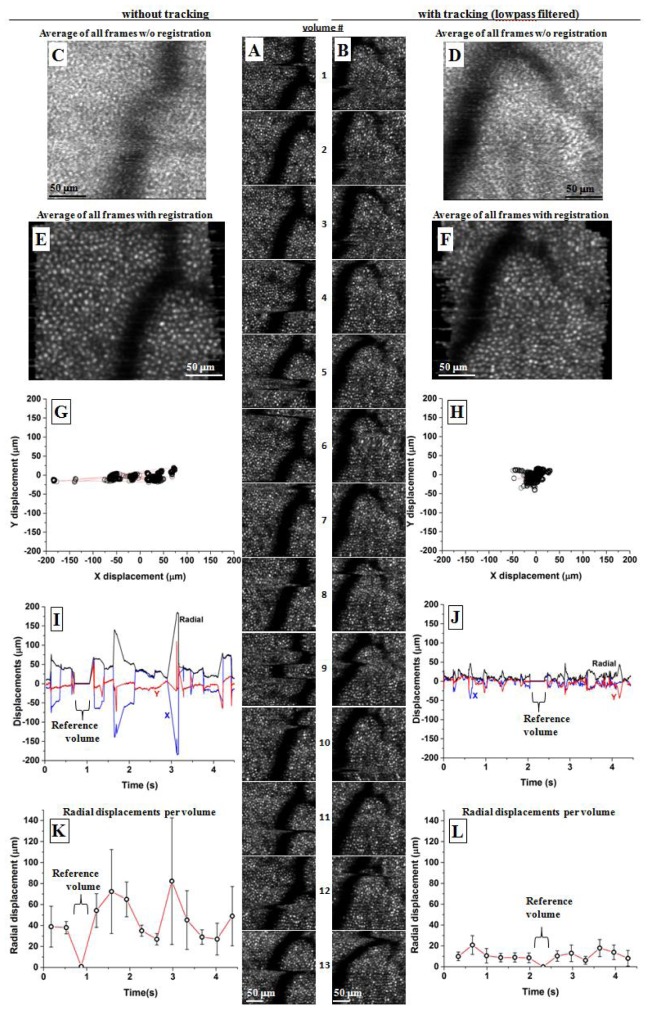
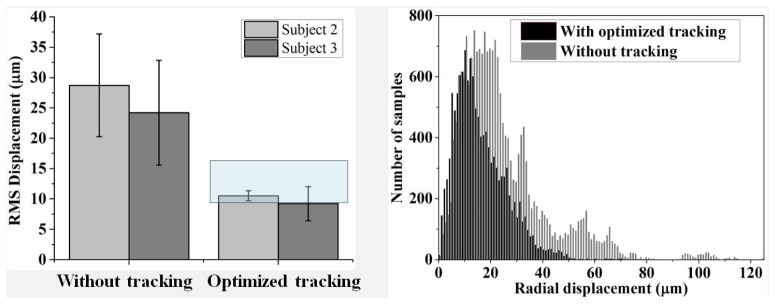
Adaptive optics optical coherence tomography (AO-OCT) is a highly sensitive and noninvasive method for three dimensional imaging of the microscopic retina. Like all in vivo retinal imaging techniques, however, it suffers the effects of involuntary eye movements that occur even under normal fixation. In this study we investigated dynamic retinal tracking to measure and correct eye motion at KHz rates for AO-OCT imaging. A customized retina tracking module was integrated into the sample arm of the 2nd-generation Indiana AO-OCT system and images were acquired on three subjects. Analyses were developed based on temporal amplitude and spatial power spectra in conjunction with strip-wise registration to independently measure AO-OCT tracking performance. After optimization of the tracker parameters, the system was found to correct eye movements up to 100 Hz and reduce residual motion to 10 µm root mean square. Between session precision was 33 µm. Performance was limited by tracker-generated noise at high temporal frequencies.

Keywords: (110.1080) Active or adaptive optics; (120.3890) Medical optics instrumentation; (170.0110) Imaging systems; (170.4470) Ophthalmology; (170.4500) Optical coherence tomography; (330.5310) Vision - photoreceptors.


Figures

Fig. 1
Fig. 1
Indiana AO-OCT system with active retina tracker. Schematic of the system is shown with tracker integrated optically via a customized beam splitter (BS2). For illustration purposes, the system is shown flattened to one plane (PM5 folds the beam vertically). Key: blue line, 809 nm AO-OCT beam; red line, 950 nm LSO beam; green line, 1060 nm tracking beam; ACL, custom achromatizing lens; BF, bandpass filter; BS, beam splitter; (C), collimator; CL, cylindrical lens; DG, diffraction grating; DM, deformable mirror; (D), detector; FT, fixation target; GS, glass slide; (L), lens; PC, polarization controller; PM, planar mirror, RS, resonant scanner, (S), scanner; SA, aperture splitting optic; SM, spherical mirror; TM, toroidal mirror; WS, wavefront sensor; WV, water vial.
Fig. 2
Fig. 2
Extraction of the photoreceptor layer from a representative AO-OCT volume acquired using imaging mode #2 (6° nasal to the fovea of Subject #2). Shown is (a) full AO-OCT volume, (b) extracted sub-volume composed primarily of the IS/OS and PTOS reflections, and (c) en face projection of the sub-volume in (b) used for motion analysis. RNFL: retinal nerve fiber layer, GCL: ganglion cell layer, IPL: inner plexiform layer, INL: inner nuclear layer, OPL: outer plxiform layer, ONL: outer nuclear layer, IS/OS: inner segment outer segment junction, PTOS: posterior tips of outer segments.
Fig. 3
Fig. 3
Illustration of the strip-wise cross-correlation method as applied to an AO-OCT en face image. Method determines X and Y displacements of a thin strip (red trace) and its central B-scan (green line) in the target image (left) relative to the reference image (right). Procedure is repeated for each of the 216 B-scans that are applied to the image. The displacements correspond to uncorrected eye motion.
Fig. 4
Fig. 4
A representative time trace of eye motion as measured with strip-wise registration. Shown is one session without tracking on subject #2. The black trace contains all measured displacements regardless of the cross-correlation coefficient value. The blue trace shows only displacements with a high cross-correlation coefficient (>0.7), indicative of reliable registration. The magenta trace is the linear interpolation used to fill the gaps in the blue trace due to low cross-correlation values (<0.7).
Fig. 5
Fig. 5
Intra-session effectiveness of retinal tracking to correct bulk motion in imaging mode #1 (Media 1). En face AO-OCT images are shown from the same sessions, (left) without and (right) with active tracking. Images are of the same nominal patch of retina at 5° nasal to the fovea and superimposed on a wide field SLO image of subject #1. In the bottom plots, open circles denote eye motion as determined from the en face frames registered manually to the wide field SLO. Solid blue trace denotes eye motion as measured by the tracker. Tracker gain was 1.3, and no lowpass filtering was applied to tracking signals.
Fig. 6
Fig. 6
Intra- and inter-session effectiveness of retinal tracking in imaging mode #1. Averaged en face images are shown for all ten sessions, five with and five without tracking. Each session contained five images from subject 1. Images are of the same nominal patch of retina at 5° nasal to the fovea. Tracker gain was 1.3, and no lowpass filtering was applied to tracking signals.
Fig. 7
Fig. 7
Initial tracker performance using imaging mode #2 (Media 2). Shown are two representative sessions, one with and the other without tracking. Each consists of (A,B) 13 contiguous en face AO-OCT images of the same approximate patch (6° nasal to the fovea) of cones of subject #2. (C,D) Average of all 13 images is shown for the two tracking cases and without registration. (E,F) Average of all 13 images is shown for the two tracking cases and with strip-wise registration applied prior to averaging. Motion displacements were determined from the strip-wise registration and plotted as (G,H) X-Y displacements, (I,J) time traces of the displacements, and (K,L) time traces of the displacements grouped by volume. Tracker gain was 1.3, and no lowpass filtering was applied to tracking signals.
Fig. 8
Fig. 8
Temporal performance of the combined tracker and AO-OCT system as measured with the strip-wise registration method. (left ordinate) Amplitude of eye motion is plotted as a function of frequency during normal fixation using a semi-log abscissa. Two cases are shown: (solid black) raw motion of the eye with no stablization and (dashed black) residual motion after correction with the PSI tracker and no lowpass filtering. Each amplitude spectra is an average of five sessions from subject #2 (6° nasal to the fovea). (right ordinate) Shown is the amplitude rejection ratio of the amplitude traces in the same plot. A rejection value of unity occurs at 240 Hz, the frequency bandwidth of the tracker AO-OCT system. Tracker gain was 1.3, and no lowpass filtering was applied to tracking signals.
Fig. 9
Fig. 9
Spatial performance of the tracker system. (top) Average power spectra are plotted for en face images of cone photoreceptors for seven gain levels of the tracker (G = 0, 0.1, 0.3, 0.6, 1, 1.3, 1.6). Images for the seven gains were acquired in consecutive sessions on subject #2 (6° nasal to the fovea). Each average power spectrum was computed from the 13 AO-OCT images that composed the session. Two different average power spectra are shown, PS_of_Avg (Eq. (1) and Avg_of_PS (Eq. (2), the former sensitive to eye motion and the latter insensitive. Spectra were circumferentially averaged. Note the semilog ordinate. No image registration was applied. (bottom) Ratios of PS_of_Avg to Avg_of_PS are shown using the traces in the top plot. Ratios correspond to Eqs. (3) and (4). Because of the semilog ordinate in the top plot, the ratio is equal to the difference between the log traces.
Fig. 10
Fig. 10
Optimized tracker performance using imaging mode #2 (Media 3) with a tracker cutoff frequency and gain set at 100 Hz and 1.0, respectively. Shown are two sessions, one without and the other with tracking. Each consists of (A,B) 13 contiguous en face AO-OCT images of the same approximate patch of cones (6° nasal to the fovea) of subject #2. (C,D) Average of all 13 images is shown for the two tracking cases and without registration. (E,F) Average of all 13 images is shown for the two tracking cases and with strip-wise registration applied prior to averaging. Motion displacements were quantified from the strip-wise registration and plotted as (G,H) X-Y displacements, (I,J) time traces of the displacements, and (K,L) time traces of the displacements grouped by volume. See text for additional details.
Fig. 11
Fig. 11
Stabilization of the tracking AO-OCT system over 20 imaging sessions: five imaging sessions per tracking case per subject. Images were acquired with imaging mode #2, and motion displacements measured with strip-wise registration. (left) RMS displacement is across all 13 volumes of the same session and averaged across five sessions. Error bars denote +/− one standard deviation of displacements across the five sessions. Superimposed on the tracking portion of the plot is a semitransparent box that marks the approximate performance range of earlier versions of the PSI tracker reported in the literature [24, 31] (right). Histograms show the radial displacements measured relative to the reference frame of each session. Separate histograms are shown with and without tracking, each combining the measurements from ten sessions, five from subjects 2 and five from subject 3.

References

    1. Fernández E. J., Povazay B., Hermann B., Unterhuber A., Sattmann H., Prieto P. M., Leitgeb R., Ahnelt P., Artal P., Drexler W., “Three-dimensional adaptive optics ultrahigh-resolution optical coherence tomography using a liquid crystal spatial light modulator,” Vision Res. 45(28), 3432–3444 (2005).10.1016/j.visres.2005.08.028 - DOI - PubMed
    1. Zawadzki R. J., Jones S. M., Olivier S. S., Zhao M., Bower B. A., Izatt J. A., Choi S., Laut S., Werner J. S., “Adaptive-optics optical coherence tomography for high-resolution and high-speed 3D retinal in vivo imaging,” Opt. Express 13(21), 8532–8546 (2005).10.1364/OPEX.13.008532 - DOI - PMC - PubMed
    1. Zhang Y., Rha J., Jonnal R. S., Miller D. T., “Adaptive optics parallel spectral domain optical coherence tomography for imaging the living retina,” Opt. Express 13(12), 4792–4811 (2005).10.1364/OPEX.13.004792 - DOI - PubMed
    1. Zawadzki R. J., Choi S. S., Jones S. M., Oliver S. S., Werner J. S., “Adaptive optics-optical coherence tomography: optimizing visualization of microscopic retinal structures in three dimensions,” J. Opt. Soc. Am. A 24(5), 1373–1383 (2007).10.1364/JOSAA.24.001373 - DOI - PMC - PubMed
    1. Cense B., Koperda E., Brown J. M., Kocaoglu O. P., Gao W., Jonnal R. S., Miller D. T., “Volumetric retinal imaging with ultrahigh-resolution spectral-domain optical coherence tomography and adaptive optics using two broadband light sources,” Opt. Express 17(5), 4095–4111 (2009).10.1364/OE.17.004095 - DOI - PMC - PubMed