. 2014 Apr 1:1:80-88.
doi: 10.1016/j.lssr.2014.02.006.

Mitochondria regulate DNA damage and genomic instability induced by high LET radiation

Affiliations

Mitochondria regulate DNA damage and genomic instability induced by high LET radiation

Bo Zhang et al. Life Sci Space Res (Amst). .

Abstract

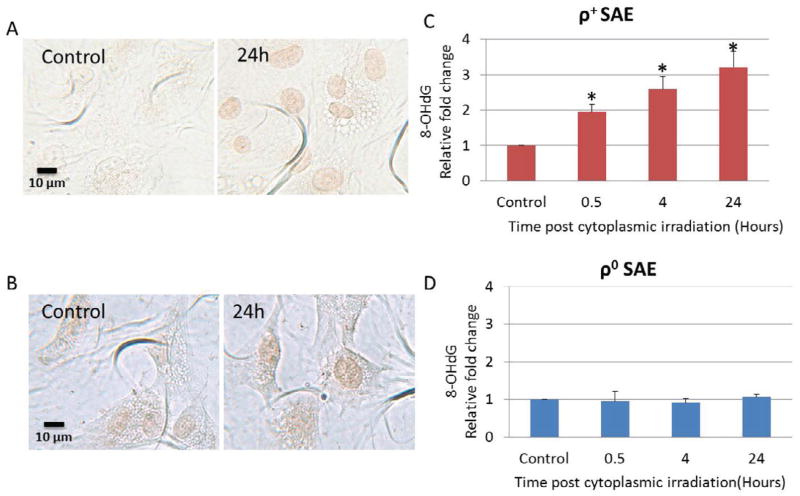
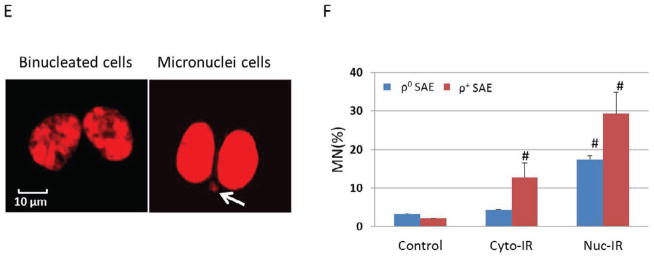
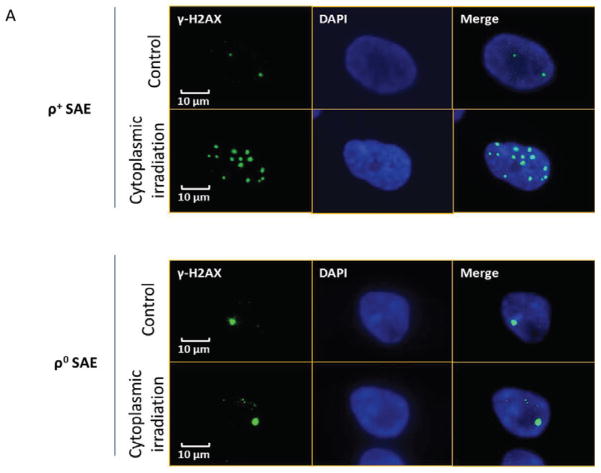
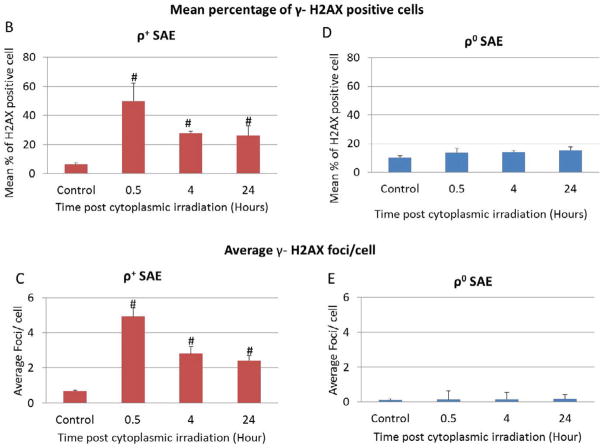
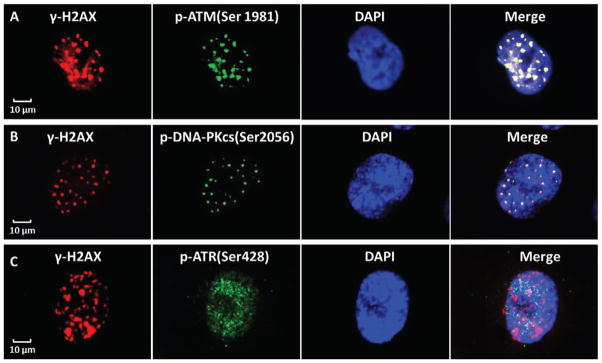
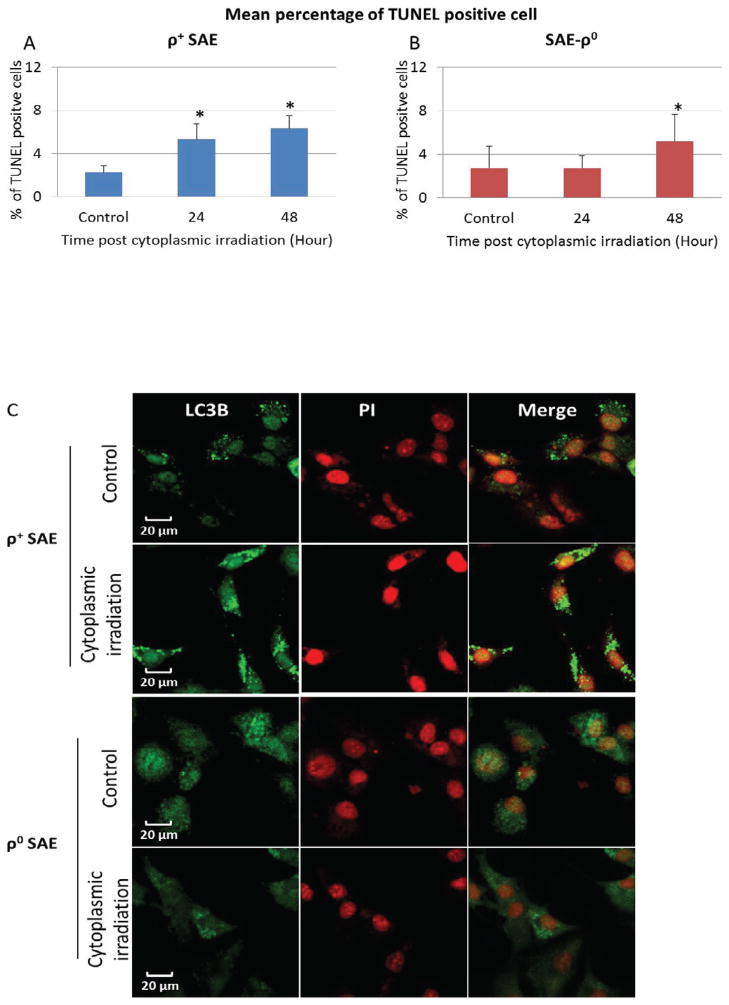
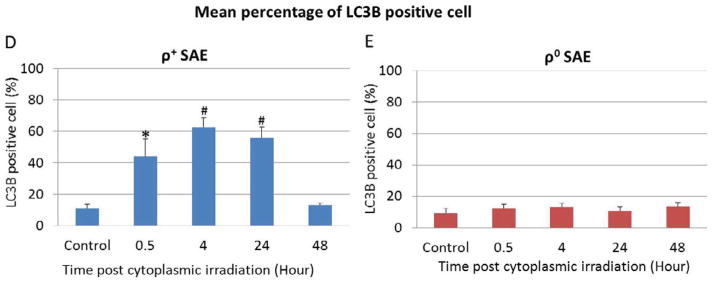
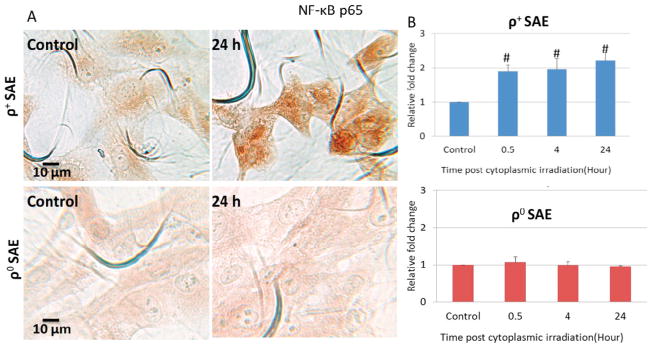
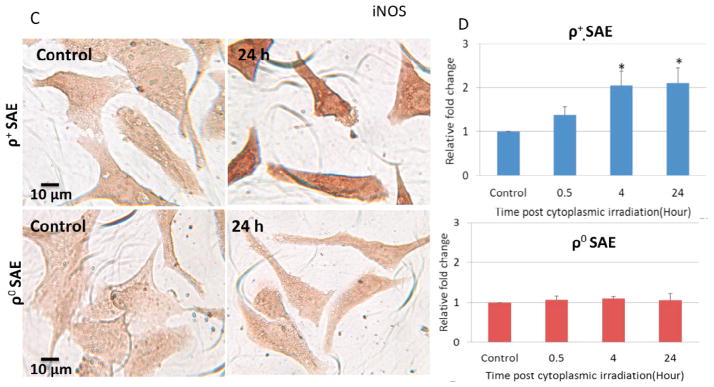
High linear energy transfer (LET) radiation including α particles and heavy ions is the major type of radiation find in space and is considered a potential health risk for astronauts. Even though the chance that these high LET particles traversing through the cytoplasm of cells is higher than that through the nuclei, the contribution of targeted cytoplasmic irradiation, to the induction of genomic instability and other chromosomal damages induced by high LET radiation is not known. In the present study, we investigated whether mitochondria are the potential cytoplasmic target of high LET radiation in mediating cellular damage using a mitochondrial DNA (mtDNA) depleted (ρ0) human small airway epithelial (SAE) cell model and a precision charged particle microbeam with a beam width of merely one micron. Targeted cytoplasmic irradiation by high LET α particles induced DNA oxidative damage and double strand breaks in wild type ρ+ SAE cells. Furthermore, there was a significant increase in autophagy, micronuclei, which is an indication of genomic instability, together with the activation of nuclear factor kappa-B (NF-κB) and mitochondrial inducible nitric oxide synthase (iNOS) signaling pathways in ρ+ SAE cells. In contrast, ρ0 SAE cells exhibited a significantly lower response to these same endpoints examined after cytoplasmic irradiation with high LET α particles. The results indicate that mitochondria are essential in mediating cytoplasmic radiation induced genotoxic damage in mammalian cells. Furthermore, the findings may shed some light in the design of countermeasures for space radiation.

Keywords: Mitochondria; ROS; autophagy; genomic instability.


Conflict of interest statement

Conflict of interest

The authors declare that they have no actual or potential competing financial interests.

Figures

Figure 1
Figure 1
ρ0 SAE cells were less responsive than ρ+ SAE cells to high LET cytoplasmic irradiation induced nuclear DNA oxidative damage and micronucleus formation. A. Detection of 8-OHdG by immunocytochemistry. Representative images of untreated and cytoplasmic irradiated ρ+ SAE cells. B. Representative images of untreated and cytoplasmic irradiated ρ0 SAE cells. C. D. Relative quantification of 8-OHdG staining intensity induced by cytoplasmic irradiation in ρ+ SAE cells (C) and ρ0 SAE cells (D). Images were quantified by Image J software. The average intensity (mean ± SD) per cell was obtained from 200 cells per sample. #, P<0.01 versus the control group. E. Representative images of micronuclei image of ρ+ SAE cells irradiated with ten α particles cytoplasmic irradiation. Arrows indicate micronuclei. F. Nuclear irradiation induced an increased micronuclei level in both ρ+ and ρ0 SAE cells. Cytoplasmic irradiation increased micronuclei in ρ+ SAE cells, however, ρ0 SAE cells did not show significant increase of micronuclei formation. Data represent mean ± SD of three independent experiments. In each experiment, 200 cells were scored. #, P<0.01 versus the non-irradiated control.
Figure 1
Figure 1
ρ0 SAE cells were less responsive than ρ+ SAE cells to high LET cytoplasmic irradiation induced nuclear DNA oxidative damage and micronucleus formation. A. Detection of 8-OHdG by immunocytochemistry. Representative images of untreated and cytoplasmic irradiated ρ+ SAE cells. B. Representative images of untreated and cytoplasmic irradiated ρ0 SAE cells. C. D. Relative quantification of 8-OHdG staining intensity induced by cytoplasmic irradiation in ρ+ SAE cells (C) and ρ0 SAE cells (D). Images were quantified by Image J software. The average intensity (mean ± SD) per cell was obtained from 200 cells per sample. #, P<0.01 versus the control group. E. Representative images of micronuclei image of ρ+ SAE cells irradiated with ten α particles cytoplasmic irradiation. Arrows indicate micronuclei. F. Nuclear irradiation induced an increased micronuclei level in both ρ+ and ρ0 SAE cells. Cytoplasmic irradiation increased micronuclei in ρ+ SAE cells, however, ρ0 SAE cells did not show significant increase of micronuclei formation. Data represent mean ± SD of three independent experiments. In each experiment, 200 cells were scored. #, P<0.01 versus the non-irradiated control.
Figure 2
Figure 2
Cytoplasmic irradiation induced DNA DSBs in ρ+ SAE cells. A. Immunofluorescent staining of γ-H2AX foci in ρ+ and ρ0 SAE cells treatment with ten α particles cytoplasmic irradiation at 0.5 hours. B. Percentage of γ-H2AX positive cells after cytoplasmic irradiation in both ρ+ and ρ0 SAE cells. C. Average foci per cell in ρ+ and ρ0 SAE cells post cytoplasmic irradiation. Mean percentage of γ-H2AX foci=cells with more than two γ-H2AX foci/total count cells number #, P<0.01 versus the control group. Bars indicate ± SD. Results were repeated in three other experiments. In each experiment, 100 cells were scored.
Figure 2
Figure 2
Cytoplasmic irradiation induced DNA DSBs in ρ+ SAE cells. A. Immunofluorescent staining of γ-H2AX foci in ρ+ and ρ0 SAE cells treatment with ten α particles cytoplasmic irradiation at 0.5 hours. B. Percentage of γ-H2AX positive cells after cytoplasmic irradiation in both ρ+ and ρ0 SAE cells. C. Average foci per cell in ρ+ and ρ0 SAE cells post cytoplasmic irradiation. Mean percentage of γ-H2AX foci=cells with more than two γ-H2AX foci/total count cells number #, P<0.01 versus the control group. Bars indicate ± SD. Results were repeated in three other experiments. In each experiment, 100 cells were scored.
Figure 3
Figure 3
ATM and DNA-PKcs participate in cytoplasmic irradiation induced DNA damage repair in ρ+ SAE cells. A. Immunofluoresent staining of γ-H2AX and p-ATM (Ser1981) in ρ+ SAE cells. The γ-H2AX was labeled in red and p-ATM was labeled in green, the yellow in the merge shows γ-H2AX and p-ATM colocalization in the nucleus. B. The γ-H2AX was labeled in red and p-DNA-PKcs (Ser2056) was labeled in green, the yellow in the merge shows γ-H2AX and p-DNA-PKcs colocalization in the nucleus. C. The γ-H2AX (Red) shows foci in the nucleus, however, ATR (Ser428) staining is diffuse (green) post cytoplasmic irradiation. These representative images show 0.5 hours post cytoplasmic irradiation.
Figure 4
Figure 4
High LET radiation targeted at cytoplasm induces apoptosis and autophagy in ρ+ SAE cells. A. Percentage of apoptosis cells induced by cytoplasmic irradiation in ρ+ and ρ0 SAE cells was detected by TUNEL stain. B. Percentage of the autophagy in ρ+ and ρ0 SAE cells post ten α particles cytoplasmic irradiation. C. Representative image of LC3B staining of autophagy in ρ+ and ρ0 SAE cells post ten α particles cytoplasmic irradiation. #, P<0.01, *, P<0.05 versus the control group. Bars indicate ± SD. Results are mean of three independent experiments. In each experiment, 100 cells were scored.
Figure 4
Figure 4
High LET radiation targeted at cytoplasm induces apoptosis and autophagy in ρ+ SAE cells. A. Percentage of apoptosis cells induced by cytoplasmic irradiation in ρ+ and ρ0 SAE cells was detected by TUNEL stain. B. Percentage of the autophagy in ρ+ and ρ0 SAE cells post ten α particles cytoplasmic irradiation. C. Representative image of LC3B staining of autophagy in ρ+ and ρ0 SAE cells post ten α particles cytoplasmic irradiation. #, P<0.01, *, P<0.05 versus the control group. Bars indicate ± SD. Results are mean of three independent experiments. In each experiment, 100 cells were scored.
Figure 5
Figure 5
Effects of NF-κB in the regulation of genomic instability induced by cytoplasmic irradiation in ρ+ SAE cells. A. Representative image of NF-κB p65 immunocytochemistry staining of ρ+ and ρ0 SAE cells. B. Quantification of NF-κB p65 by mean gray value of ρ+ and ρ0 SAE cells. Levels of NF-κB p65 were significantly increased post cytoplasmic irradiation with ten α particles in ρ+ SAE cells but not in ρ0 SAE cells. C. Representative image of iNOS immunocytochemistry staining of ρ+ and ρ0 SAE cells. D. iNOS expression were significantly increased induced by cytoplasmic irradiation in ρ+ SAE cells, however, ρ0 SAE cells showed no response. #, P<0.01, *, P<0.05 versus the control group. Bars indicate ± SD. Results were repeated in three other experiments. In each experiment, 100 cells were scored.
Figure 5
Figure 5
Effects of NF-κB in the regulation of genomic instability induced by cytoplasmic irradiation in ρ+ SAE cells. A. Representative image of NF-κB p65 immunocytochemistry staining of ρ+ and ρ0 SAE cells. B. Quantification of NF-κB p65 by mean gray value of ρ+ and ρ0 SAE cells. Levels of NF-κB p65 were significantly increased post cytoplasmic irradiation with ten α particles in ρ+ SAE cells but not in ρ0 SAE cells. C. Representative image of iNOS immunocytochemistry staining of ρ+ and ρ0 SAE cells. D. iNOS expression were significantly increased induced by cytoplasmic irradiation in ρ+ SAE cells, however, ρ0 SAE cells showed no response. #, P<0.01, *, P<0.05 versus the control group. Bars indicate ± SD. Results were repeated in three other experiments. In each experiment, 100 cells were scored.

Similar articles

Cited by

References

    1. Durante M, Cucinotta FA. Heavy ion carcinogenesis and human space exploration. Nat Rev Cancer. 2008;8:465–472. - PubMed
    1. Hada M, Wu H, Cucinotta FA. mBAND analysis for high- and low-LET radiation-induced chromosome aberrations: a review. Mutat Res. 2011;711:187–192. - PubMed
    1. Hong M, Xu A, Zhou H, Wu L, Randers-Pehrson G, Santella RM, et al. Mechanism of genotoxicity induced by targeted cytoplasmic irradiation. Br J Cancer. 2010;103:1263–1268. - PMC - PubMed
    1. Nugent S, Mothersill CE, Seymour C, McClean B, Lyng FM, Murphy JEJ. Altered mitochondrial function and genome frequency post exposure to γ-radiation and bystander factors. Int J Radiat Biol. 2010;86:829–841. - PubMed
    1. Anderson S, Bankier AT, Barrell BG, de Bruijn MH, Coulson AR, Drouin J, et al. Sequence and organization of the human mitochondrial genome. Nature. 1981;290:457–465. - PubMed

LinkOut - more resources