. 2014 Jul 29:5:4500.
doi: 10.1038/ncomms5500.

Individual diet has sex-dependent effects on vertebrate gut microbiota

Affiliations

Individual diet has sex-dependent effects on vertebrate gut microbiota

Daniel I Bolnick et al. Nat Commun. .

Abstract

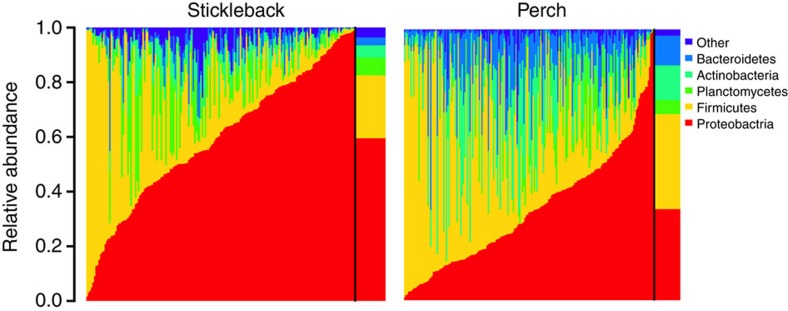
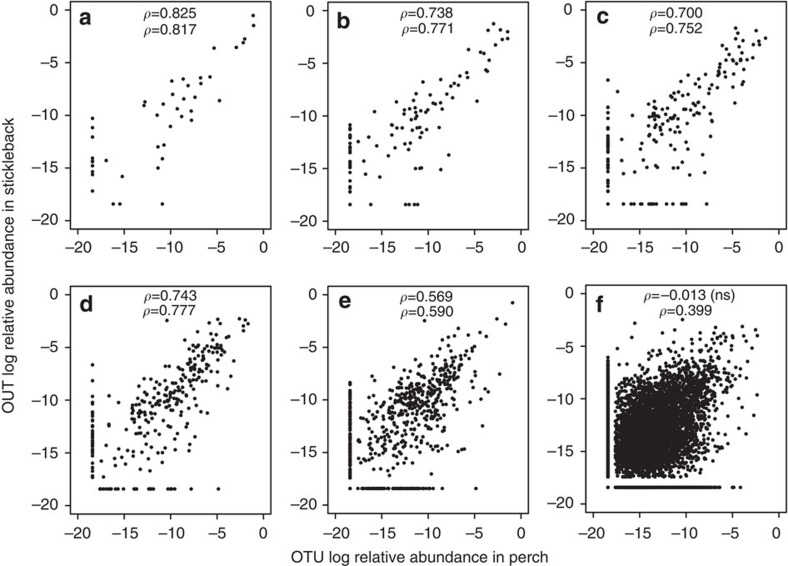
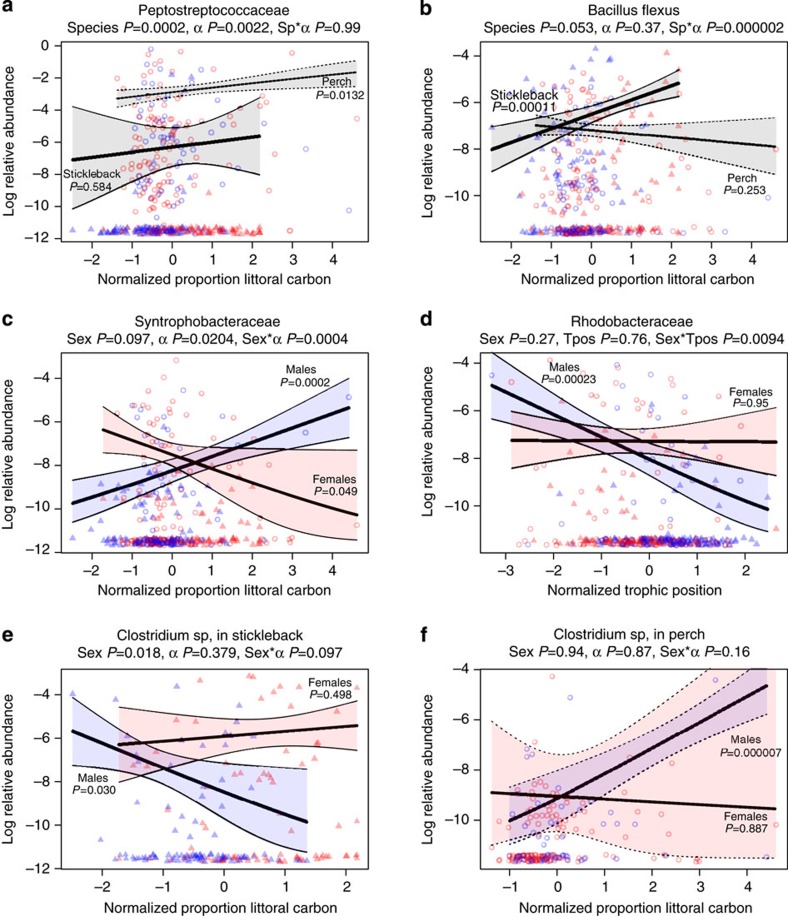
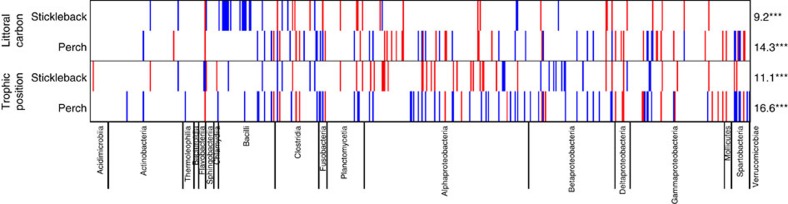
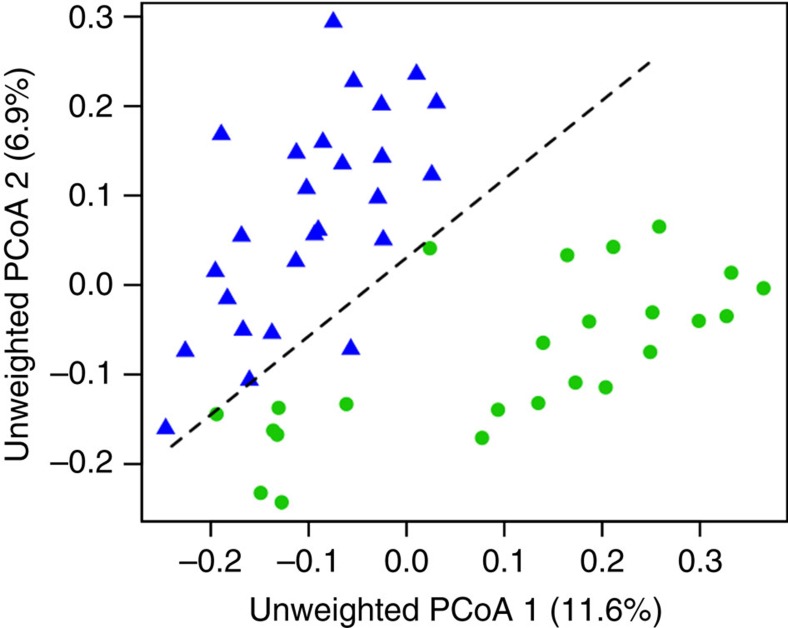
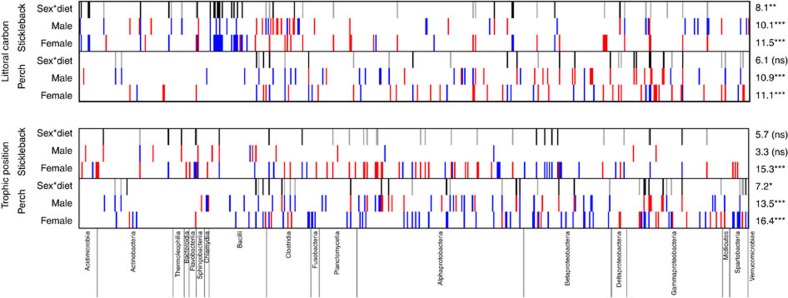
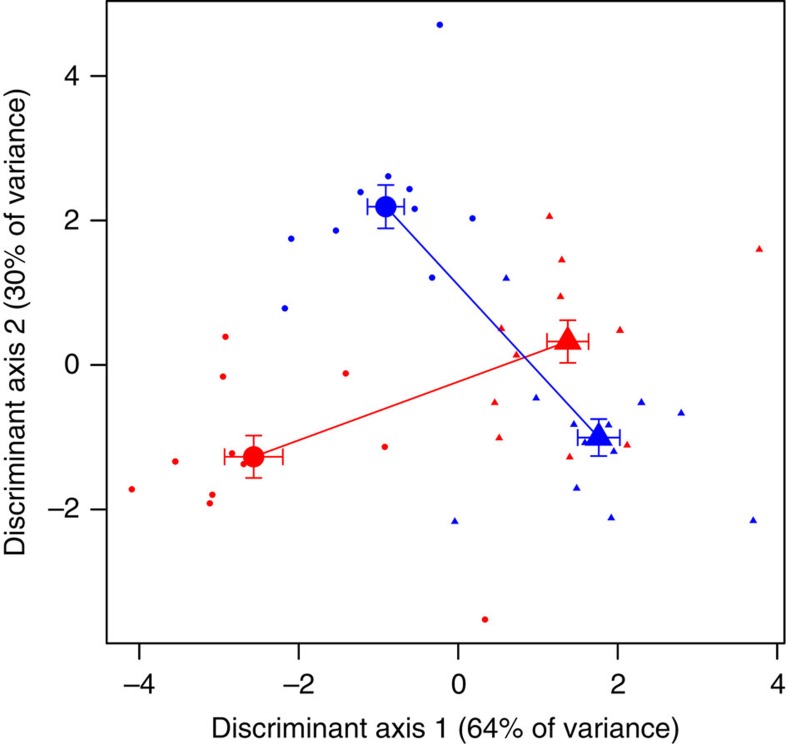
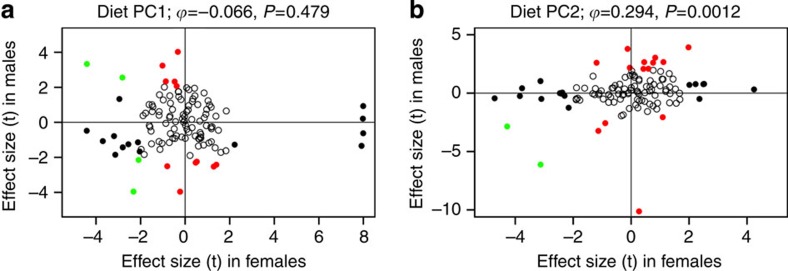
Vertebrates harbour diverse communities of symbiotic gut microbes. Host diet is known to alter microbiota composition, implying that dietary treatments might alleviate diseases arising from altered microbial composition ('dysbiosis'). However, it remains unclear whether diet effects are general or depend on host genotype. Here we show that gut microbiota composition depends on interactions between host diet and sex within populations of wild and laboratory fish, laboratory mice and humans. Within each of two natural fish populations (threespine stickleback and Eurasian perch), among-individual diet variation is correlated with individual differences in gut microbiota. However, these diet-microbiota associations are sex dependent. We document similar sex-specific diet-microbiota correlations in humans. Experimental diet manipulations in laboratory stickleback and mice confirmed that diet affects microbiota differently in males versus females. The prevalence of such genotype by environment (sex by diet) interactions implies that therapies to treat dysbiosis might have sex-specific effects.


Figures

Figure 1
Figure 1. There is substantial among-individual heterogeneity in gut microbiota composition within stickleback and perch populations.
Columns represent the relative abundance of microbial phyla within individual hosts, and population mean abundance to the right of the black line. In stickleback, Proteobacteria ranged from 1.6 to 98.9% of individuals’ microbiota (mean=57%; 1.1–99.8% in perch). Similar among-individual variation is observed at lower taxonomic ranks (for example, among classes within a phylum). This heterogeneity among individuals is particularly striking, given the strong similarity in mean microbiota composition between stickleback and perch (Fig. 2).
Figure 2
Figure 2. Microbial taxon relative abundance is correlated between perch and stickleback.
For (a) phyla, (b) classes, (c) orders, (d) families, (e) genera and (f) all OTUs. Spearman rank correlations are provided for each taxonomic level (top value: all taxa, bottom: shared taxa), all P<0.00001 except f. To plot taxa absent in one host, a small value was added to all frequencies before log transformation. Complete information on taxonomic composition, relative abundance and prevalence are provided in Supplementary Data 1.
Figure 3
Figure 3. Selected examples of microbial OTU responses to diet.
Triangles and open circles represent stickleback and perch, respectively. Red/blue indicates females and males. Lines represent quasibinomial GLM estimates with confidence intervals (coloured by sex, grey if combining sexes). GLM estimates of P-values for model terms are included next to trend lines or in panel headings. Headings indicate the lowest known taxonomic identity of the OTU. OTUs presented here were chosen to illustrate several distinct patterns: (a) overall effect of α in both host species for an OTU in the Peptostreptococcaceae. There is also a host species effect (P=0.0002), but no interaction effects as diet has parallel (albeit not equally significant) effects in each host. Overall, 11.3 % of abundant OTUs exhibited a main effect of α across both hosts (11.5% for tpos). This represents a unique demonstration that environmental effects on the microbiota can be (weakly) extrapolated from one host species to another. (b) A species-specific effect of carbon source on Bacillus flexus abundance in stickleback but not perch, underlying a significant species*diet interaction (P=0.0001). This OTU also exhibits a sex*species interaction because B. flexus is more abundant in stickleback males than in females (P=0.000014), whereas it shows a nonsignificant tendency to be more abundant in female than male perch (P=0.0954). Neither species exhibits a significant sex*α interaction. (c) A sex-specific carbon effect on a Syntrophobacteraceae OTU, which is more abundant in littoral males (P=0.049) and in pelagic females (P=0.0002) regardless of host species. (d) Sex-specific trophic position (tpos) effect in which a Syntrophobacteraceae OTU is more common in low trophic position males (P=0.00023), regardless of host species, but is insensitive to trophic position in females (P=0.95). (e,f) A sex*carbon*species interaction on Clostridium sp abundance, which exhibits opposite diet effects in male stickleback versus male perch (more common in pelagic male stickleback P=0.03, and in littoral male perch P=0.000007), but is independent of female diet in both hosts.
Figure 4
Figure 4. Widespread effects of diet on relative abundances of microbe OTUs in perch and stickleback.
Rows represent different diet effects (proportion littoral carbon or trophic position) in each of the two host species. Each column in the heatmap represents one of the 566 abundant OTUs (averaging >0.01% relative abundance), arranged by taxonomic group (names of Classes are provided along the bottom of the figure). Thin vertical red bars indicate OTUs whose relative abundance decreases significantly (P<0.05) with the diet metric in a quasibinomial GLM for the focal host species. Blue bars indicate OTUs whose relative abundance increases with the diet metric. On the right side of the figure, we indicate the percentage of the abundant OTUs that exhibit significant main effects of diet within each host species. Asterisks indicate whether this percentage significantly exceeds the 5% expected from false positives (***P<0.001).
Figure 5
Figure 5. Experimentally manipulated diet alters gut microbiota composition in captive threespine stickleback.
Differences in microbiota composition (unweighted PCoA axes 1+2) between male stickleback fed littoral versus pelagic prey. Daphnia-fed fish are indicated by blue triangles, chironomid-fed fish are green circles. The percentages in the axis labels indicate the percentage of total variation in microbial community structure that is associated with each PCoA axis. A dashed line separates the two treatments to emphasize the nearly non-overlapping differences between diet treatments. A MANOVA confirmed that unweighted PCoA axes 1–12 (top 50% of variation) exhibit a significant association with diet (P=0.00004), but not tank (P=0.283). Similar effects were observed for weighted PCoAs (diet P=0.000002; tank P=0.889).
Figure 6
Figure 6. The relative abundances of some microbial OTUs depend on an interaction between sex and diet, in both perch and stickleback.
The top heatmaps represent how OTUs covary with host individuals’ proportional reliance on littoral carbon (α). The bottom heatmaps represent the effects of host trophic position on OTU abundance. Each column represents one of the 566 abundant OTUs (averaging >0.01% relative abundance), arranged by taxonomic group (names of classes are provided along the bottom of the figure). Within each heatmap, rows with red/blue bars indicate the effect of a given diet measure on individual OTUs for (from top to bottom) male stickleback, female stickleback, male perch and female perch. Thin vertical red bars indicate OTUs whose relative abundance decreases significantly (P<0.05) with the diet metric in a quasibinomial GLM for the focal host species and sex. Blue bars indicate OTUs whose relative abundance increases with the diet metric (a ‘positive’ effect). For each diet measure and species, we also include a row indicating OTUs with significant sex*diet interaction effects in the GLM. Black bars represent OTUs with more positive diet effects in females than males. This can arise, for example, when (i) an OTU is more abundant in high tpos females (positive effect) and unresponsive to tpos in males (no effect), (ii) when an OTU is unresponsive to tpos in females (no effect) but decreases with tpos in males (negative effect), or (iii) when an OTU changes with tpos in both sexes but exhibits a more positive slope in females. Grey bars represent OTUs with more positive diet effects in males than females. On the right side of the figure, we indicate the percentage of the abundant OTUs that exhibit significant main effects of diet within each host sex/species combination, or that exhibit sex*diet interactions. Asterisks indicate whether this percentage significantly exceeds the 5% expected from false positives (*P<0.05; **P<0.01; ***P<0.001).
Figure 7
Figure 7. Microbiota exhibit different responses to diet in captive male and female stickleback.
We obtained gut microbial DNA from lab-reared stickleback fed chironomids (15 females, 13 males) and Daphnia (14 females, 13 males). We obtained a total of 5,226,827 sequence reads from 15 females (red points) and 13 males (blue points) experimentally fed chironomids (circles), and 14 females and 13 males fed Daphnia (triangles). We averaged 54,446 sequence reads per sample (range: 406–299,947; mean of 31,409), identified as 1,460 microbial OTUs. Here we plot individuals’ scores along the first two linear DFA of microbiota composition (unweighted PCoA axes 1–21) that separate groups (combinations of sex and diet). Larger points with s.e. bars indicate group means. Within each sex, lines represent the diet effect (connecting means for Daphnia- to chironomid-fed fish); the angle between these lines emphasizes the sex-dependent diet effects. In particular, the following taxa are more common in Daphnia-fed males and chironomid-fed females: OTUs in the families Hyphomonadaceae (P=0.0000014), Isosphaeraceae (P=0.00006), Haliangiaceae (P=0.00016), Staphylococcaceae (P=0.0015), Pirellulaceae (P=0.0018), Aeromonadaceae (P=0.0035) and Saprospiraceae (P=0.0036), and in the genera Burkholderia (P=0.000010), Veillonella (P=0.0000012), Staphylococcus (P=0.000018), Stenotrophomonas (P=0.00135) and Paracoccus (P=0.0018).
Figure 8
Figure 8. Comparison between male and female diet effects on the human gut microbiota.
Diet is measured here by the top two principal component axes of detailed nutritional data from Wu et al., see Supplementary Data 3 for PC loadings to interpret these axes. Diet effects are uncorrelated (A: diet PC1) or weakly positively correlated (B: diet PC2) between males and females. Each point represents the female and male diet effect on one of the 125 most abundant OTUs (>0.1% mean relative abundance). Diet effect is measured as a t-statistic, scaling the slope of OTU relative abundance versus diet PC score (calculated in a sex-specific quasibinomial GLM), by the s.e. of that slope. Open points are not statistically significant (P>0.05). Black points are significant in females, red significant in males and green points are significant in both. Horizontal and vertical lines visually distinguish OTUs with positive effect estimates in both sexes (top right quadrant), or negative effects in both sexes (bottom left), or opposite effects in males versus females (top left or bottom right). Spearman rank correlation tests are provided above each panel.

References

    1. Ley R. E., Lozupone C. A., Hamady M., Knight R. & Gordon J. I. Worlds within worlds: evolution of the vertebrate gut microbiota. Nat. Rev. Microbiol. 6, 776–788 (2008). - PMC - PubMed
    1. Hamady M. & Knight R. Microbial community profiling for human microbiome projects: Tools, techniques, and challenges. Genome Res. 19, 1141–1152 (2009). - PMC - PubMed
    1. Cheesman S. E., Neal J. T., Mittge E., Seredick B. M. & Guillemin K. Epithelial cell proliferation in the developing zebrafish intestine is regulated by the Wnt pathway and microbial signaling via Myd88. Proc. Natl Acad. Sci. 108, 4570–4577 (2011). - PMC - PubMed
    1. Zhu L., Wu Q., Dai J., Zhang S. & Wei F. Evidence of cellulose metabolism by the giant panda gut microbiome. Proc. Natl Acad. Sci. 108, 17714–17719 (2011). - PMC - PubMed
    1. Lathrop S. K. et al. Peripheral education of the immune system by colonic commensal microbiota. Nature 478, 250–254 (2011). - PMC - PubMed

Publication types

MeSH terms