. 2014 Jul 29;4(7):e417.
doi: 10.1038/tp.2014.59.

Free D-aspartate regulates neuronal dendritic morphology, synaptic plasticity, gray matter volume and brain activity in mammals

Affiliations

Free D-aspartate regulates neuronal dendritic morphology, synaptic plasticity, gray matter volume and brain activity in mammals

F Errico et al. Transl Psychiatry. .

Abstract

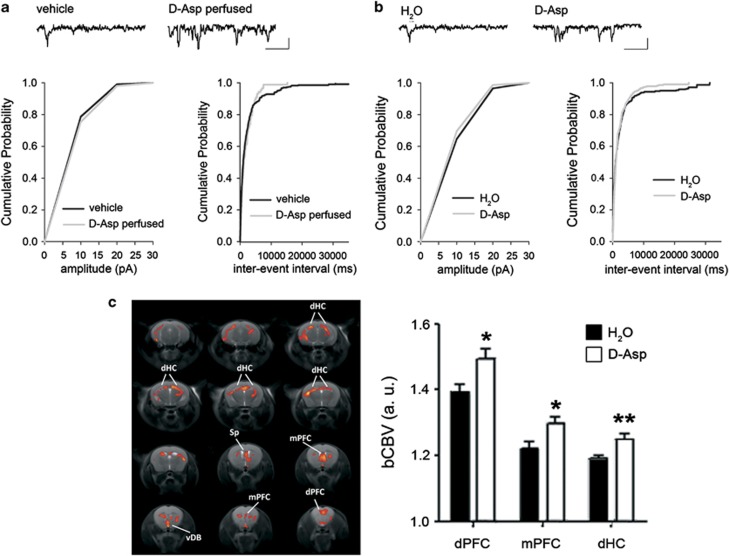
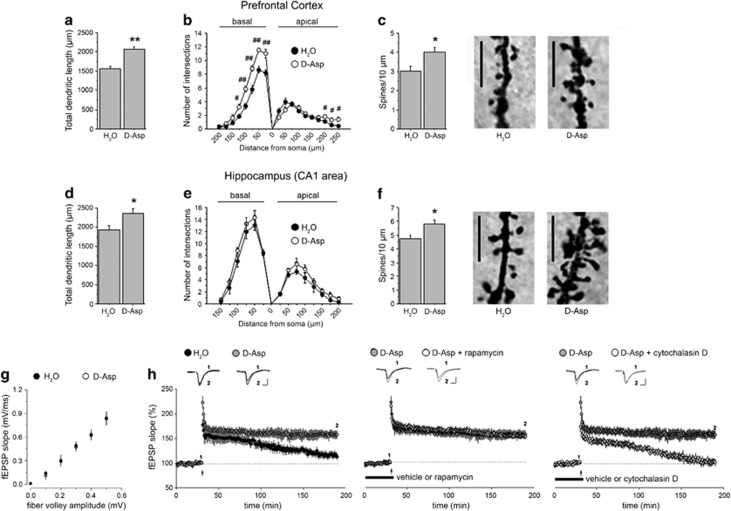
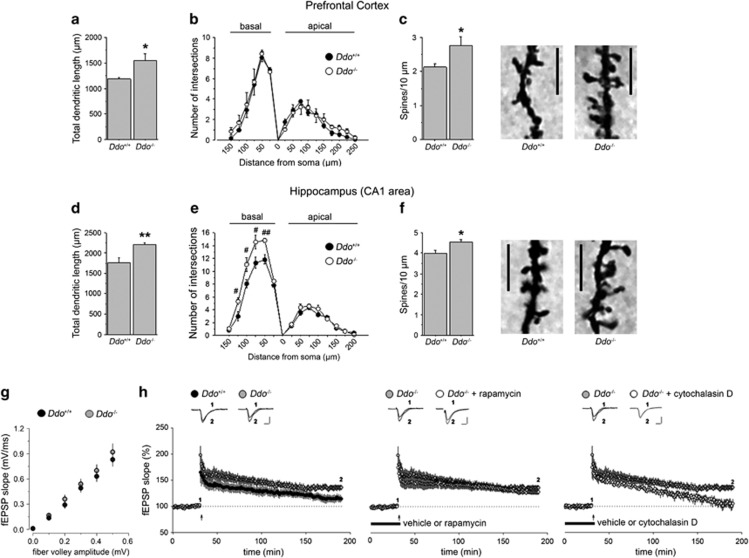
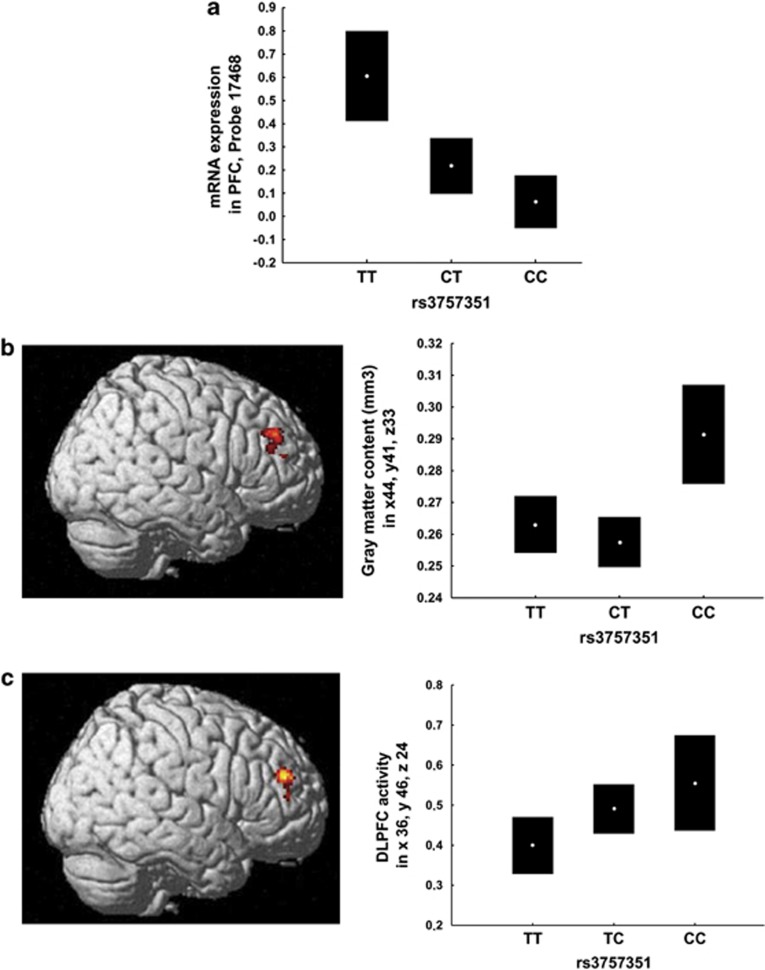
D-aspartate (D-Asp) is an atypical amino acid, which is especially abundant in the developing mammalian brain, and can bind to and activate N-methyl-D-Aspartate receptors (NMDARs). In line with its pharmacological features, we find that mice chronically treated with D-Asp show enhanced NMDAR-mediated miniature excitatory postsynaptic currents and basal cerebral blood volume in fronto-hippocampal areas. In addition, we show that both chronic administration of D-Asp and deletion of the gene coding for the catabolic enzyme D-aspartate oxidase (DDO) trigger plastic modifications of neuronal cytoarchitecture in the prefrontal cortex and CA1 subfield of the hippocampus and promote a cytochalasin D-sensitive form of synaptic plasticity in adult mouse brains. To translate these findings in humans and consistent with the experiments using Ddo gene targeting in animals, we performed a hierarchical stepwise translational genetic approach. Specifically, we investigated the association of variation in the gene coding for DDO with complex human prefrontal phenotypes. We demonstrate that genetic variation predicting reduced expression of DDO in postmortem human prefrontal cortex is mapped on greater prefrontal gray matter and activity during working memory as measured with MRI. In conclusion our results identify novel NMDAR-dependent effects of D-Asp on plasticity and physiology in rodents, which also map to prefrontal phenotypes in humans.


Figures

Figure 1
Figure 1
Effect of D-aspartate (D-Asp) treatment on NMDAR-dependent miniature excitatory post-synaptic currents and basal metabolic function in fronto-septo-hippocampal areas of adult mice. (a) Pooled (mean) cumulative distributions of mEPSCsNMDA amplitude (left panel, n=8 for vehicle, n=8 for D-Asp perfused; bin size 10 pA; K-S test P>0.05) and inter-event interval (right panel, n=8 for vehicle, n=8 for D-Asp perfused; bin size 50 ms; K-S test P<0.001) recorded in mPFC layer II/III pyramidal neurons in the absence or presence of perfused D-Asp (300 μM). Representative traces of NMDAR current detected in the mPFC layer II/III pyramidal neurons before and after exogenous perfusion of D-Asp (top). Scale: vertical bar, 10 pA; horizontal bar, 1s. (b) Pooled (mean) cumulative distributions of mEPSCsNMDA amplitude (left panel, n=9 for H2O, n=9 for D-Asp; bin size 50 ms; K-S test P>0.05) and inter-event interval (right panel, n=9 for H2O, n=9 for D-Asp; bin size 50 ms; K-S test P<0.001) recorded in the mPFC layer II/III pyramidal neurons from C57BL/6J mice untreated or treated for 1 month with a 20 mM D-Asp solution. (c) Anatomical distribution of brain areas exhibiting a significant increase in bCBV in mice exposed to D-Asp with respect to vehicle controls (P<1.7, corrected cluster significance P=0.001). Activation maps (red/orange) are superimposed onto contiguous 0.75 mm MRI coronal images. a.u., arbitrary unit; DdHC, dorsal hippocampus; dPFC, dorsal prefrontal cortex; mPFC, medial prefrontal cortex; Sp, septum; vDB, ventral diagonal band.
Figure 2
Figure 2
Dendritic morphology and late-phase LTP in mice treated with D-aspartate (D-Asp). Analysis of dendritic morphology was performed on C57BL/6J mice drinking D-Asp or H2O in pyramidal neurons of the (a–c) PFC (n=5 mice per treatment, 5 neurons per mouse) and (d–f) CA1 subfield of the hippocampus (n=5 mice per treatment, 4 neurons per mouse) after Golgi-Cox staining. (a and d) Total dendritic length (in μm) measured in the (a) PFC and (d) CA1 subfield of the hippocampus. (b and e) Number of intersections between basal or apical dendrites and Sholl concentric circle lines at different distances from soma center in both (b) PFC and (e) CA1 area. Concentric circles increase in diameter by 25 μm increments. (c and f) Spine density (number of spines per 10 μm) evaluated in (c) the PFC and (f) CA1 area of mice. The right panels show representative dendrites. **P<0.01, *P<0.05, compared with untreated mice (Student's t-test). ##P<0.01, #P<0.05, compared with untreated mice (Fisher's post hoc). Scale bar, 5 μm. (g) Input–output relation of field excitatory postsynaptic potentials (fEPSPs) as a function of presynaptic fiber volley size shows similar fEPSPs slopes over a range of stimulus intensities for both untreated C57BL/6J (n=6) and D-Asp-treated C57BL/6J (n=6) mice. Data are expressed as mean±s.e.m. (P>0.05, Student's t-test). (h) Time plot of hippocampal fEPSP responses showing the effect of E-LTP stimulation paradigm in untreated C57BL/6J mice and D-Asp-treated C57BL/6J mice (n=6 mice per treatment; left panel). Hippocampal L-LTP in D-Asp-treated mice was unaffected following bath-application of 20 nM rapamycin (transiently bath-applied for 40 min; n=6 vehicle-treated slices, n=5 rapamycin-treated slices; middle graph) but was fully blocked following bath-application of 100 nM cytochalasin D (continuously bath-applied; n=6 vehicle-treated slices, n=5 cytochalasin D-treated slices; right panel). Insets show field EPSPs from representative experiments during baseline and following LTP induction (1 s, 100 Hz tetanus). Vertical bar, 0.5 mV; horizontal bar, 10 ms. LTP, long-term potentiation; PFC, prefrontal cortex.
Figure 3
Figure 3
Dendritic morphology and late-phase LTP in Ddo−/− mice. Analysis of dendritic morphology was performed on Ddo+/+ and Ddo−/− mice in pyramidal neurons of the (a–c) PFC (n=5 mice per genotype, 3 neurons per mouse) and (d–f) CA1 subfield of the hippocampus (n=5 mice per genotype, 4 neurons per mouse) after Golgi-Cox staining. (a and d) Total dendritic length (in μm) performed in the (a) PFC and (d) CA1 subfield of the hippocampus. (b and e) Number of intersections between basal or apical dendrites and Sholl concentric circle lines at different distances from soma center in both (b) PFC and (e) CA1 area. Concentric circles increase in diameter by 25 μm increments. (c and f) Spine density (number of spines per 10 μm) evaluated in both (c) the PFC and (f) the CA1 area. The right panels show representative dendrites. *P<0.05, compared with Ddo+/+ mice (Student's t-test). ##P<0.01, #P<0.05, compared with Ddo+/+ mice (Fisher's post hoc). Scale bar, 5 μm. (g) Input–output relation shows comparable fEPSPs slopes for both Ddo+/+ (n=6) and Ddo−/− (n=6) littermates (P>0.05, Student's t-test). (h) Time plot of hippocampal fEPSP responses showing that (left panel) an E-LTP stimulation paradigm elicited E-LTP in Ddo+/+ mice and L-LTP in Ddo−/− mice (n=7 for Ddo+/+, n=7 for Ddo−/−; left panel). Hippocampal L-LTP in Ddo−/− slices was insensitive to the effects of rapamycin (transiently bath-applied for 40 min; n=7 vehicle-treated Ddo−/− slices, n=5 rapamycin-treated Ddo−/− slices; middle panel) but was fully prevented by cytochalasin D (continuously bath-applied; n=7 for vehicle-treated Ddo−/− slices, n=6 for cytochalasin D-treated Ddo−/− slices; right panel). Insets show field EPSPs from representative experiments during a baseline interval and following LTP induction (1 s, 100 Hz tetanus). Scale: vertical bar, 0.5 mV; horizontal bar, 10 ms. All data are expressed as mean±s.e.m. LTP, long-term potentiation; PFC, prefrontal cortex.
Figure 4
Figure 4
Association of DDO rs3757351 with prefrontal phenotypes in humans. (a) Association of DDO rs3757351 with DDO mRNA expression levels in postmortem PFC (n=268). Graph depicts normalized log2 ratios (sample/reference). Data from http://braincloud.jhmi.edu/; (b) Association of DDO rs3757351 with prefrontal gray matter volume in Caucasian healthy subjects (n=159). Left panel: three-dimensional rendering of the prefrontal cluster associated with a main effect of rs3757351. Image thresholded at P<0.005, nonstationary cluster extend corrected. Right panel: graph showing mean±0.95 CIs of gray matter content extracted from the cluster depicted in the left panel. (c) Association of DDO rs3757351 with prefrontal BOLD response during working memory in Caucasian healthy subjects (n=143). Left panel: Three-dimensional rendering of the prefrontal cluster associated with a main effect of rs3757351. Image thresholded at P<0.05, FWE corrected. Right panel: graph showing mean±0.95 CIs of parameter estimated extracted from the cluster depicted in the left panel. CI, confidence interval; DLPFC, dorsolateral PFC; PFC, prefrontal cortex.

References

    1. Mothet JP, Snyder SH. Brain D-amino acids: a novel class of neuromodulators. Amino Acids. 2012;43:1809–1810. - PubMed
    1. Snyder SH, Ferris CD. Novel neurotransmitters and their neuropsychiatric relevance. Am J Psychiatry. 2000;157:1738–1751. - PubMed
    1. Fuchs SA, Berger R, de Koning TJ. D-serine: the right or wrong isoform. Brain Res. 2011;1401:104–117. - PubMed
    1. Billard JM. D: -Amino acids in brain neurotransmission and synaptic plasticity. Amino Acids. 2012;43:1851–1860. - PubMed
    1. Martineau M, Baux G, Mothet JP. D-serine signalling in the brain: friend and foe. Trends Neurosci. 2006;29:481–491. - PubMed

Publication types

MeSH terms