. 2014 Oct;28(10):1656-69.
doi: 10.1210/me.2014-1117. Epub 2014 Jul 29.

Genome-wide analysis of histone modifications in human endometrial stromal cells

Affiliations

Genome-wide analysis of histone modifications in human endometrial stromal cells

Isao Tamura et al. Mol Endocrinol. 2014 Oct.

Abstract

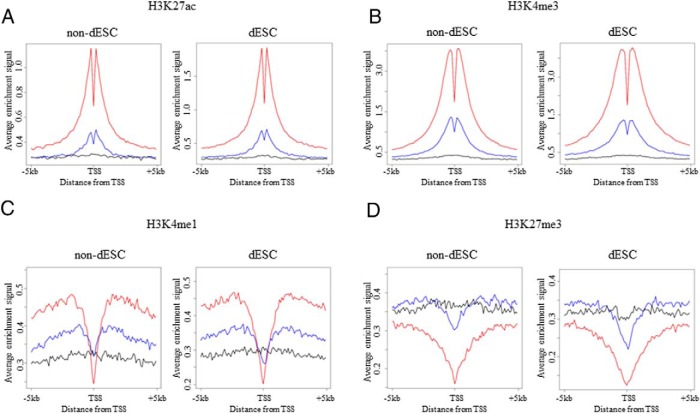
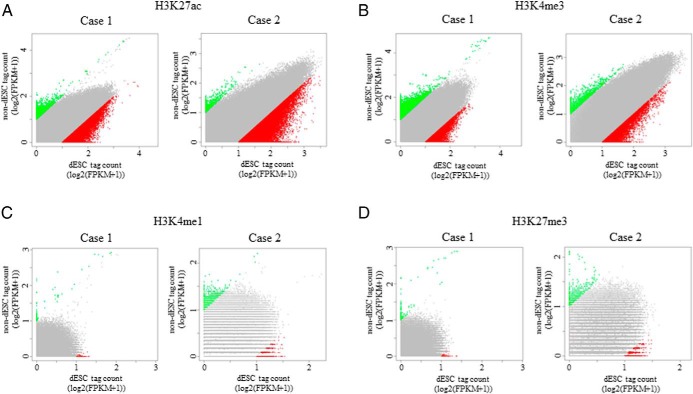
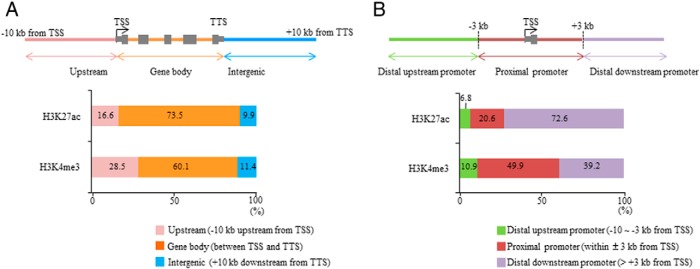
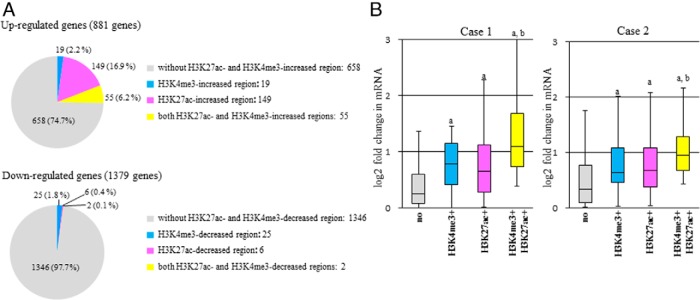
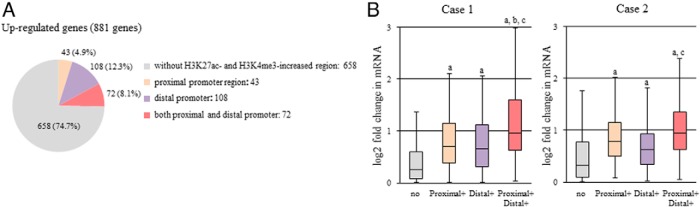
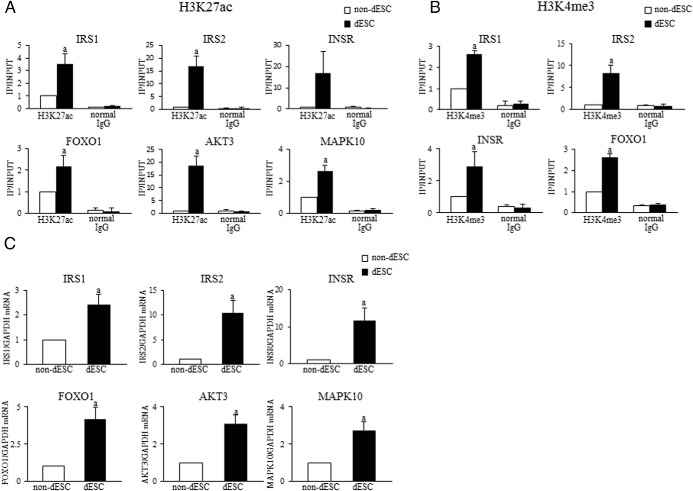
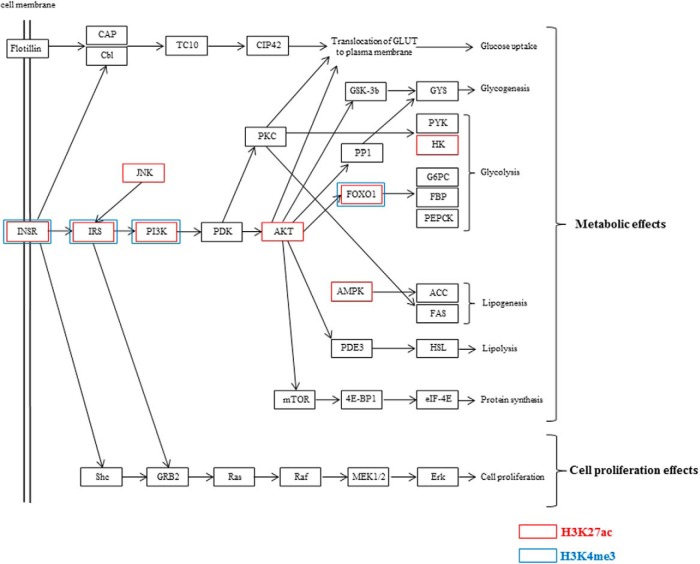
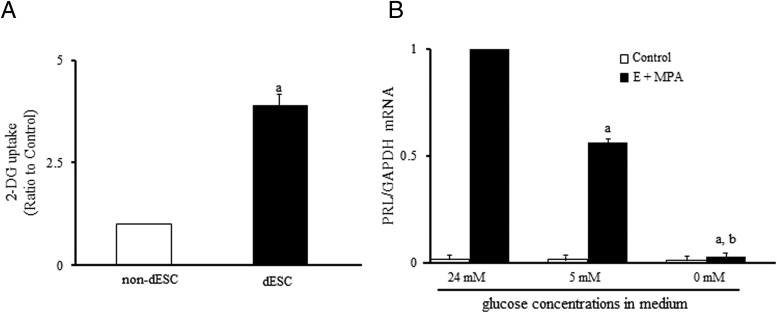
Dramatic changes of gene expressions occur in human endometrial stromal cells (ESCs) during decidualization. The changes in gene expression are associated with changes of chromatin structure, which are regulated by histone modifications. Here we investigated genome-wide changes in histone modifications associated with decidualization in human ESCs using chromatin immunoprecipitation combined with next-generation sequencing. ESCs were incubated with estradiol and medroxyprogesterone acetate for 14 days to induce decidualization. The chromatin immunoprecipitation-sequence data showed that induction of decidualization increased H3K27ac and H3K4me3 signals in many genomic regions but decreased in only a few regions. Most of the H3K27ac-increased regions (80%) and half of the H3K4me3-increased regions were located in the distal promoter regions (more than 3 kb upstream or downstream of the transcription start site). RNA sequence showed that induction of decidualization up-regulated 881 genes, 223 of which had H3K27ac- or H3K4me3-increased regions in the proximal and distal promoter regions. Induction of decidualization increased the mRNA levels of these genes more than it increased the mRNA levels of genes without H3K27ac- or H3K4me3-increased regions. Pathway analysis revealed that up-regulated genes with the H3K27ac- or H3K4me3-increased regions were associated with the insulin signaling, which may be involved in glucose uptake that is necessary for ESCs to undergo decidualization. These results show that histone modification statuses on a genome-wide basis change in human ESCs during decidualization. The main changes of histone modifications are increases of H3K27ac and H3K4me3 in both the proximal and distal promoter regions, which are involved in the up-regulation of gene expression that occurs during decidualization.


Figures

Figure 1.
Figure 1.. Genome-wide distributions of H3K27ac, H3K4me3, H3K4me1, and H3K27me3.
To examine the distribution of histone modifications in non-dESCs (treated with control medium) and dESCs (treated with E and MPA), composite profiles of each histone modification around the TSS were generated according to their expression levels: no expression, low-level expression, and high-level expression based on the mRNA levels. Average ChIP-seq signal profiles for the high-level expression (red), low-level expression (blue), and no expression (black) genes were generated for the indicated histone modifications around the TSS in non-dESCs and dESCs, respectively. Data are representatives from two different individuals.
Figure 2.
Figure 2.. Changes of genome-wide histone modification statuses by decidualization.
Histone modification signals were searched in 1-kb intervals between −10 kb and +10 kb from the TTS, and then the difference in the signals between non-dESCs and dESCs was evaluated by the scatter plot of log2-transformed FPKM values. Regions showing more than a 2-fold increase (green dots) or decrease (red dots) in signals between non-dESCs and dESCs were defined as having increased or decreased histone modifications, respectively. Gray dots represent the regions showing less than 2-fold changes. Data from two individuals (case 1 and case 2) are shown.
Figure 3.
Figure 3.. Genomic locations of H3K27ac- or H3K4me3-increased regions by decidualization.
A, The H3K27ac- or H3K4me3-increased regions were classified by the location of the signals: upstream (−10 kb upstream from the TSS), gene body (between the TSS and TTS, including introns and exons), and intergenic (+10 kb downstream from the TTS). The results are expressed as a percentage of the total regions. B, The H3K27ac- or H3K4me3-increased regions were classified into 3 groups based on the distance from the TSS: the proximal promoter (within ±3 kb region from the TSS), the distal upstream promoter (more than 3 kb upstream from the TSS), and the distal downstream promoter (more than 3 kb downstream from the TSS). The results are expressed as a percentage of the total regions.
Figure 4.
Figure 4.. Histone modifications of H3K27ac or H3K4me3 and the up- or down-regulation of gene expression by decidualization.
mRNA levels were analyzed on a genome-wide basis by RNA-seq in dESCs and non-dESCs. Eight hundred eighty-one up-regulated genes and 1379 down-regulated genes (greater than 1.4 fold changes) by decidualization stimuli were identified, which were common in the two individuals (case 1 and case 2). The common regions with altered signals of H3K27ac or H3K4me3 were identified between the two individuals (Table 1). A, Up- or down-regulated genes were classified into 4 groups based on whether they have H3K27ac- or H3K4me3-increased or decreased regions, respectively: 1) genes without H3K27ac- and H3K4me3-altered regions, 2) genes with H3K4me3-altered regions, 3) genes with H3K27ac-altered regions, and 4) genes with both H3K27ac- and H3K4me3-altered regions. The numbers of genes in each group are shown. B, The fold changes in mRNA levels of the up-regulated genes by decidualization stimuli were compared among the 4 groups in each individual. The fold changes in the mRNA levels were calculated by dividing the dESCs (RPKM+1) by the non-dESCs (RPKM+1) obtained from RNA-seq. Box plots show the distribution of log2-transformed fold change value of each group: genes without H3K27ac- and H3K4me3-increased regions (no), genes with H3K4me3-increased regions (H3K4me3+), genes with H3K27ac-increased regions (H3K27ac+), and genes with both H3K27ac- and H3K4me3-altered regions (H3K4me3+, H3K27acl+). Data from each individual (case 1 and case 2) are shown. Solid bars of boxes display the interquartile ranges (25%–75%) with an intersection as the median. The whiskers extending outside the boxes correspond to the lowest and highest data within 1.5-fold interquartile range from the upper and lower quartile. P values are calculated using a Mann-Whitney U test followed by Bonferroni correction. a, P < .01 vs no; b, P < .01 vs H3K27ac+.
Figure 5.
Figure 5.. Genomic location of H3K27ac- or H3K4me3-increased regions and the up-regulation of gene expression by decidualization.
A, Up-regulated genes by decidualization stimuli were classified into 4 groups: 1) genes without H3K27ac- and H3K4me3-increased regions, 2) genes with H3K27ac- or H3K4me3-increased regions in the proximal promoter region, 3) genes with H3K27ac- or H3K4me3-increased regions in the distal promoter region, and 4) genes with H3K27ac- or H3K4me3-increased regions in both the proximal and distal promoter regions. The distal promoter region includes both distal upstream promoter (more than 3 kb upstream from the TSS) and distal downstream promoter (more than 3 kb downstream from TSS). The numbers of genes in each group are shown. B, The fold changes in mRNA levels of the up-regulated genes by decidualization stimuli were compared among the 4 groups in each individual. The fold changes in mRNA levels were calculated by dividing the dESCs (RPKM+1) by the non-dESCs (RPKM+1) obtained from RNA-seq. Box plots show the distribution of log2-transformed fold change value of each group: genes without H3K27ac- and H3K4me3-increased regions (no), genes with H3K27ac- or H3K4me3-increased regions in the proximal promoter region (proximal+), in the distal promoter region (distal+), and in both proximal and distal promoter regions (proximal+, distal+). Data from each individual (case 1 and case 2) are shown. Solid bars of boxes display the interquartile ranges (25%–75%) with an intersection as the median. The whiskers extending outside the boxes correspond to the lowest and highest data within 1.5-fold interquartile range from the upper and lower quartile. P values are calculated using a Mann-Whitney U test followed by Bonferroni correction. a, P < .01 vs no; b, P < .05 vs proximal+; c, P < .01 vs distal+.
Figure 6.
Figure 6.. Validation of the results of ChIP-seq and RNA-seq experiments.
ESCs were treated with or without E + MPA for 14 days to induce decidualization and used for the ChIP-qPCR and real time RT-PCR experiments. Six genes (IRS1, IRS2, INSR, FOXO1, AKT3, and MAPK10) were selected as the target genes to validate the result of ChIP-seq and RNA-seq. A and B, H3K27ac and H3K4me3 levels were analyzed by ChIP-qPCR in the promoter regions of insulin signaling genes in non-dESCs and dESCs. Primers for ChIP-qPCR were designed within the H3K27ac- or H3K4me3-increased region identified by ChIP-seq. Normal mouse IgG was used as a negative control. The relative levels of histone modification status were calculated as the ratio of IP DNA to the INPUT DNA sample. Data were expressed as a ratio of the non-dESCs. Values are mean ± SEM of three different incubations. a, P < .05 vs non-dESCs. C, Relative mRNA levels of insulin signaling genes were quantified by real-time RT-PCR. Values of mRNA levels were normalized to those of GAPDH and expressed as a ratio of the non-dESCs. Values are mean ± SEM of three different incubations. a, P < .05 vs non-dESCs (unpaired t test).
Figure 7.
Figure 7.. Components of insulin signaling pathway and the up-regulated genes with H3K27ac- or H3K4me3-increased regions by decidualization.
Shown is the modified insulin signaling pathway maps obtained from DAVID web site. Red boxes indicate the up-regulated genes with H3K27ac-increased regions and blue boxes indicate the up-regulated genes with H3K4me3-increased regions by decidualization.
Figure 8.
Figure 8.. Glucose uptake and decidualization.
A, Effects of decidualization on glucose uptake in ESCs. ESCs were treated with or without E and MPA for 14 days, and glucose uptake was examined by a 2-DG uptake assay in non-dESCs and dESCs. The glucose (2-DG) uptake was expressed as a ratio of the non-dESCs (control). Values are mean ± SEM of three different incubations. a, P < .01 vs non-dESCs (unpaired t test). B, Effects of the low-glucose incubation on decidualization. ESCs were cultured in the medium containing normal (24 mM) or low (0 and 5 mM) glucose concentrations in the presence or absence of E (10−8 mol/l) and MPA (10−6 mol/l) for 14 days, and then decidualization was evaluated by PRL mRNA expression by real-time RT-PCR. Standard DMEM contains 24 mM glucose. Values of PRL mRNA levels were normalized to those of GAPDH and expressed as a ratio of the E + MPA treatment sample under the normal glucose concentration (24 mM). Values are mean ± SEM of three different incubations. a, P < .01 vs E + MPA (24 mM); b, P < .01 vs E+MPA (5 mM) (one way ANOVA followed by the Tukey-Kramer test).

Similar articles

Cited by

References

    1. Gellersen B, Brosens J. Cyclic AMP and progesterone receptor cross-talk in human endometrium: a decidualizing affair. J Endocrinol. 2003;178:357–372. - PubMed
    1. Salker M, Teklenburg G, Molokhia M, et al. . Natural selection of human embryos: impaired decidualization of endometrium disables embryo-maternal interactions and causes recurrent pregnancy loss. PLoS One. 2010;5:e10287. - PMC - PubMed
    1. Laird SM, Tuckerman EM, Li TC. Cytokine expression in the endometrium of women with implantation failure and recurrent miscarriage. Reprod Biomed Online. 2006;13:13–23. - PubMed
    1. Wang W, Taylor RN, Bagchi IC, Bagchi MK. Regulation of human endometrial stromal proliferation and differentiation by C/EBPβ involves cyclin E-cdk2 and STAT3. Mol Endocrinol. 2012;26:2016–2030. - PMC - PubMed
    1. Aghajanova L, Horcajadas JA, Weeks JL, et al. . The protein kinase A pathway-regulated transcriptome of endometrial stromal fibroblasts reveals compromised differentiation and persistent proliferative potential in endometriosis. Endocrinology. 2010;151:1341–1355. - PMC - PubMed

Publication types