. 2014 Nov;13(11):3114-25.
doi: 10.1074/mcp.M113.037127. Epub 2014 Jul 29.

Suberoylanilide hydroxamic acid (SAHA)-induced dynamics of a human histone deacetylase protein interaction network

Affiliations

Suberoylanilide hydroxamic acid (SAHA)-induced dynamics of a human histone deacetylase protein interaction network

Mihaela E Sardiu et al. Mol Cell Proteomics. 2014 Nov.

Abstract

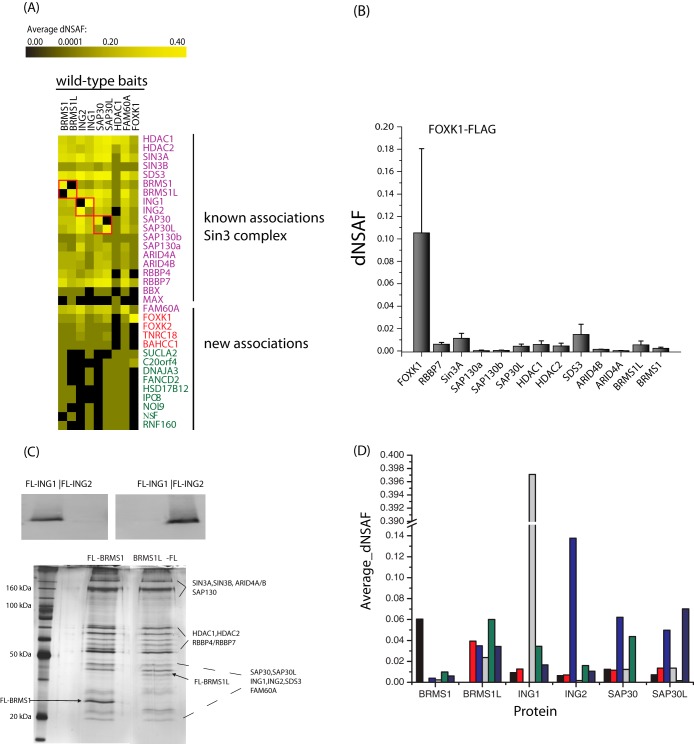
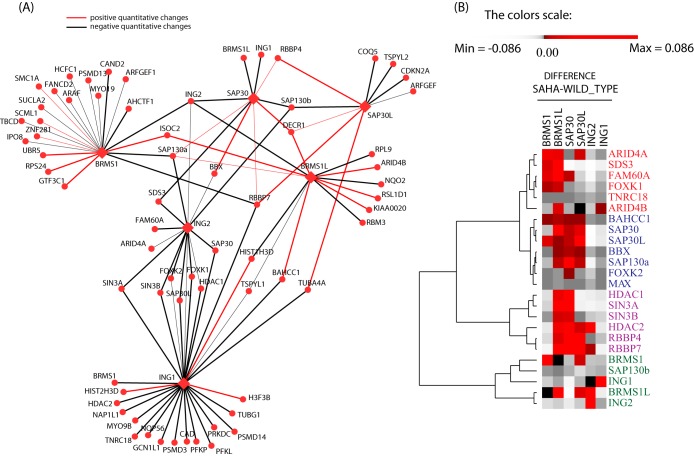
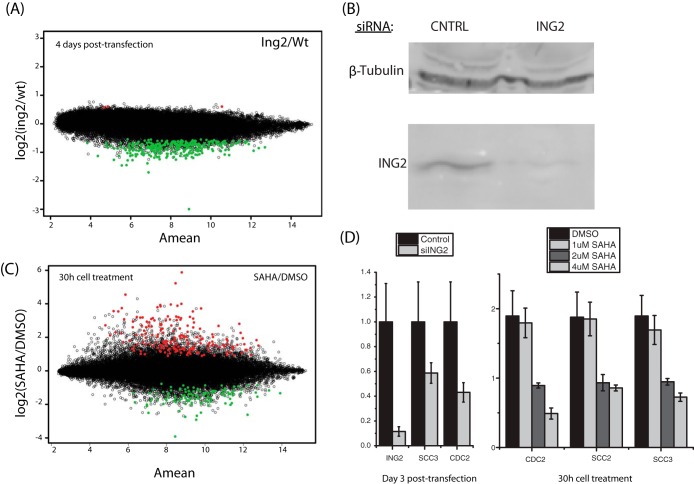
Histone deacetylases (HDACs) are targets for cancer therapy. Suberoylanilide hydroxamic acid (SAHA) is an HDAC inhibitor approved by the U.S. Food and Drug Administration for the treatment of cutaneous T-cell lymphoma. To obtain a better mechanistic understanding of the Sin3/HDAC complex in cancer, we extended its protein-protein interaction network and identified a mutually exclusive pair within the complex. We then assessed the effects of SAHA on the disruption of the complex network through six homologous baits. SAHA perturbs multiple protein interactions and therefore compromises the composition of large parts of the Sin3/HDAC network. A comparison of the effect of SAHA treatment on gene expression in breast cancer cells to a knockdown of the ING2 subunit indicated that a portion of the anticancer effects of SAHA may be attributed to the disruption of ING2's association with the complex. Our dynamic protein interaction network resource provides novel insights into the molecular mechanism of SAHA action and demonstrates the potential for drugs to rewire networks.


Figures

Fig. 1.
Fig. 1.
Defining the Sin3 complexes. A, heat map of the Sin3 complexes. Composition of the Sin3 complex as represented in a bait–prey matrix, where each column corresponds to a purification of a bait protein and each row corresponds to a prey protein; protein abundances are represented as average dNSAF values. The color intensity represents the protein abundance, with brightest yellow indicating the greatest abundance and decreasing intensity indicating decreased abundance. Black indicates that the protein was not detected in the particular purification. The protein BBX did not meet our criteria; however, because it is known to be related to the complex, and for clarity, we have included it in the figure. Unique peptides to both Sap130a and Sap130b were found in the study. Homologous pairs (BRMS1-BRMS1L, SAP30-SAP30L, and ING1-ING2) are represented in red boxes. B, protein abundance values of FOXK1 relative to the subunits of the Sin3 complex. C, Western blots showing that ING1 and ING2 may reside in separate Sin3/HDAC complexes. Silver stain analysis of the BRMS1-FLAG and BRMS1L-FLAG complexes purified from whole cell 293T extract. D, analysis of the average dNSAF observed for the three homologous pairs.
Fig. 2.
Fig. 2.
BRMS1 and BRMS1L are mutually exclusive. A, B, 293T cells stably expressing BRMS1L-FLAG were transfected with BRMS1 (BRMS1Txf_ BRMS1L-FLAG), and 293T cells stably expressing FLAG-BRMS1 were transfected with BRMS1L (BRMS1LTxf_FLAG-BRMS1). Noticeable amounts of BRMS1 and BRMS1L were detected in the lysate as well as in the elution after proteins were enriched by FLAG affinity purification. The whole cell lysate and the FLAG elution were visualized in Western blots. Both homologous proteins were detected using anti-BMRS1 and anti-BRMS1L rabbit monoclonal (abcam-ab-134968) and polyclonal (abcam-ab155188) primary antibodies and IRDye™-800-labeled goat anti-rabbit IgG secondary antibodies (green). A Li-Cor Odyssey infrared imaging system was used to detect the fluorescently labeled secondary antibodies. It is important to note that these antibodies have cross-reactivity with other proteins in the samples, but the highest intensity bands at the appropriate molecular weight are the areas of the Western blots to focus on. C, D, analysis of the average dNSAF observed in the BRMS1 and BRMS1L purifications. Proteins purified from cells expressing BRMS1LTxf_FLAG-BRMS1 and BRMS1Txf_BRMS1L-FLAG were analyzed with MudPIT. The normalized dNSAF values of the Sin3/HDAC complex are shown for either BRMS1LTxf_FLAG-BRMS1 (C) or BRMS1Txf_BRMS1L-FLAG (D). Error bars show standard deviation.
Fig. 3.
Fig. 3.
SAHA-induced differential network analysis. A, the SAHA interaction network of Sin3/HDAC-centered complexes. The SAHA drug-interaction differential network was generated from six purifications (BRMS1, BRMS1L, SAP30, SAP30L, ING2, and ING1) from SAHA-treated cells. All Bait_SAHA (bait purification after SAHA treatment) proteins are depicted as hexagons, and all preys as circles. Edges are colored based on the fold change between treated and untreated samples using the z-score. Black lines correspond to interactions increasing in abundance (i.e. a z-score ≥ 1.5), and red lines represent interactions with decreasing abundance (i.e. a z-score ≤ −1.5) as shown in top left of A. The thickness of the lines corresponds to the degree of the effect caused by the SAHA treatment in the respective baits. The isoforms Sap130a and Sap130b were both included because unique peptides to each isoform were found in the study. B, hierarchical clustering was performed on the difference between dNSAF averages from Sin3 subunit purifications from SAHA-treated cells and untreated counterparts. Each column represents an individual purification, and each row represents a prey protein. Red color illustrates that SAHA treatment did not affect the complex, whereas gray color symbolizes a strong effect of SAHA on the Sin3 network. Through hierarchical clustering, subcomplexes were separated as illustrated on the right-hand side of the cluster.
Fig. 4.
Fig. 4.
SAHA treatment and ING2 knockdown gene expression changes. A, decreased expression of ING2 in human breast cancer cells and the resulting effect on gene expression relative to a control as examined using Affymetrix Human microarrays (HG-U133 Plus 2.0). The y-axis indicates the ratio expression as log2(ING2 knockdown/control), and the x-axis represents the combined intensity of the array measurements for each sample, ½ × (log2(ing2) + log2(wt)). The top 300 genes are highlighted in color. Surprisingly, of the top 300 genes that were differentially expressed, 99% were down-regulated. B, Western blots from ING2 knockdown (RNAi) experiments in MDA-MB-231 breast cancer cells using antibodies against β-tubulin or ING2. C, changes in gene expression in a human breast cancer cell line upon treatment with the histone deacetylase inhibitor SAHA. Breast cancer cells were treated with 2 μm SAHA (HDAC inhibitor) for 30 h. The y-axis indicates the gene expression ratio between treated and untreated cells as log2(SAHA/DMSO), and the x-axis represents the combined intensity of the array measurements for each sample as ½ × (log2(SAHA) + log2(DMSO)). The top 300 up- or down-regulated genes are highlighted in color. D, real-time PCR was performed to quantify CDC2 transcript levels in ING2 knockdown MDA-MB-231 cells. Cells were day 3 post-transfected with control siRNAs or siRNAs against ING2. Real-time PCR was performed using primers to ING2 and GAPDH. Bars represent the average of triplicate real-time PCR reactions. Error bars represent ±1 average deviation. In addition, real-time PCR was performed in cells treated with 1, 2, and 4 μm SAHA or DMSO for 30 h.
Fig. 5.
Fig. 5.
SAHA gene and disease network linkages. A, protein–disease connectivity map. Each column represents a disease, and each row represents a protein involved in one of the diseases. The numbers inside the matrix correspond to the number of disease subtype (for example, multiple types of cancer). Light orange corresponds to the group of proteins that have a connectivity weight of 1 or 2, and dark red corresponds to the group of proteins involved in multiple diseases with many subtypes and thereby having larger weight numbers. B, Sin3 disease network. Each node represents a disease, and two diseases are connected to each other if they share at least two proteins that are associated with both diseases. The size of the circle is proportional to the total number of links.

References

    1. Brouwers L., Iskar M., Zeller G., van Noort V., Bork P. (2011) Network neighbors of drug targets contribute to drug side-effect similarity. PLoS One 6, e22187. - PMC - PubMed
    1. Paolini G. V., Shapland R. H., van Hoorn W. P., Mason J. S., Hopkins A. L. (2006) Global mapping of pharmacological space. Nat. Biotechnol. 24, 805–815 - PubMed
    1. Rix U., Superti-Furga G. (2009) Target profiling of small molecules by chemical proteomics. Nat. Chem. Biol. 5, 616–624 - PubMed
    1. Ververis K., Hiong A., Karagiannis T. C., Licciardi P. V. (2013) Histone deacetylase inhibitors (HDACIs): multitargeted anticancer agents. Biologics 7, 47–60 - PMC - PubMed
    1. Hashioka S., Klegeris A., McGeer P. L. (2012) The histone deacetylase inhibitor suberoylanilide hydroxamic acid attenuates human astrocyte neurotoxicity induced by interferon-gamma. J. Neuroinflamm. 9, 113 - PMC - PubMed

Publication types

MeSH terms