

HIV-1 DNA decay dynamics in blood during more than a decade of suppressive antiretroviral therapy
- PMID: 25073894
- PMCID: PMC4200019
- DOI: 10.1093/cid/ciu585
HIV-1 DNA decay dynamics in blood during more than a decade of suppressive antiretroviral therapy
Abstract
Background: Human immunodeficiency virus type 1 (HIV-1) DNA dynamics during long-term antiretroviral therapy (ART) are not defined.
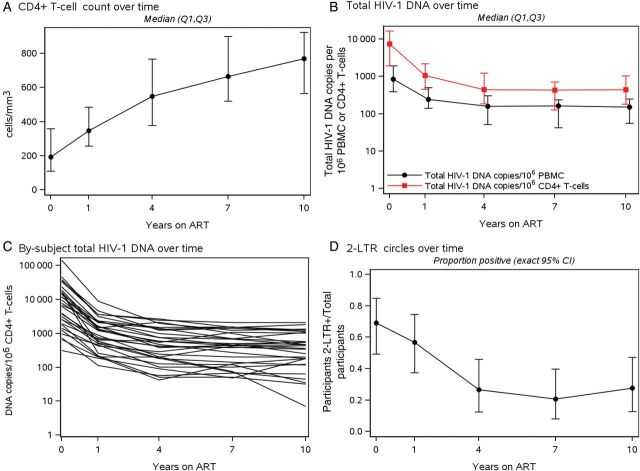
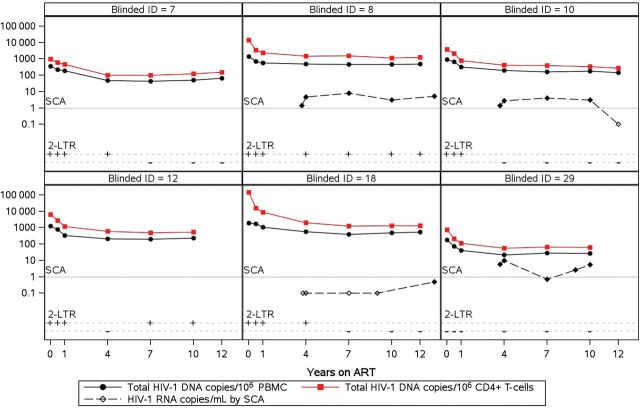
Methods: Blood mononuclear cells obtained during 7-12 years of effective ART were assayed for total HIV-1 DNA and 2-long terminal repeat (LTR) circles by quantitative polymerase chain reaction (qPCR). Slopes of HIV-1 DNA were estimated by participant-specific linear regressions. Plasma was assayed for residual viremia (HIV-1 RNA) by qPCR.
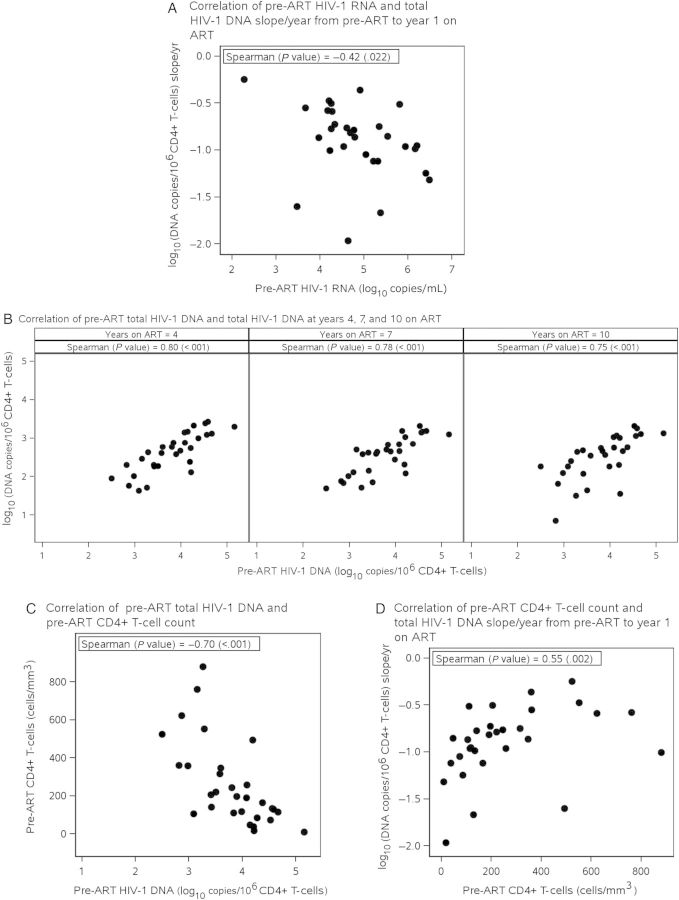
Results: Thirty participants were studied. HIV-1 DNA decreased significantly from years 0-1 and 1-4 of ART with median decay slopes of -0.86 (interquartile range, -1.05, -0.59) and -0.11 (-0.17, -0.06) log10(copies/10(6) CD4+ T-cells)/year, respectively (P < .001). Decay was not significant for years 4-7 (-0.02 [-0.06, 0.02]; P = .09) or after year 7 of ART (-0.006 [-0.030, 0.015]; P = .17). All participants had detectable HIV-1 DNA after 10 years (median 439 copies/10(6) CD4+ T-cells; range: 7-2074). Pre-ART HIV-1 DNA levels were positively associated with pre-ART HIV-1 RNA levels (Spearman = 0.71, P < .001) and with HIV-1 DNA at years 4, 7, and 10 on ART (Spearman ≥ 0.75, P < .001). No associations were found (P ≥ .25) between HIV-1 DNA slopes or levels and % activated CD8+ T-cells (average during years 1-4) or residual viremia (n = 18). 2-LTR circles were detected pre-ART in 20/29 and in 8/30 participants at last follow-up.
Conclusions: Decay of HIV-1 DNA in blood is rapid in the first year after ART initiation (86% decline), slows during years 1-4 (23% decline/year), and subsequently plateaus. HIV-1 DNA decay is not associated with the levels of CD8+ T-cell activation or persistent viremia. The determinants of stable HIV-1 DNA persistence require further elucidation. Clinical Trials Registration. NCT00001137.
Keywords: HIV-1 persistence; antiretroviral therapy; HIV-1 DNA decay; immune activation.
© The Author 2014. Published by Oxford University Press on behalf of the Infectious Diseases Society of America. All rights reserved. For Permissions, please e-mail: journals.permissions@oup.com.
Figures
References
-
- Koelsch KK, Liu L, Haubrich R, et al. Dynamics of total, linear nonintegrated, and integrated HIV-1 DNA in vivo and in vitro. J Infect Dis. 2008;197:411–9. - PubMed
Publication types
MeSH terms
Substances
Associated data
Grants and funding
LinkOut - more resources
Full Text Sources
Other Literature Sources
Medical
Research Materials
