. 2014 Sep 15;74(18):5336-47.
doi: 10.1158/0008-5472.CAN-14-1349. Epub 2014 Jul 29.

Genetic ablation of metadherin inhibits autochthonous prostate cancer progression and metastasis

Affiliations

Genetic ablation of metadherin inhibits autochthonous prostate cancer progression and metastasis

Liling Wan et al. Cancer Res. .

Abstract

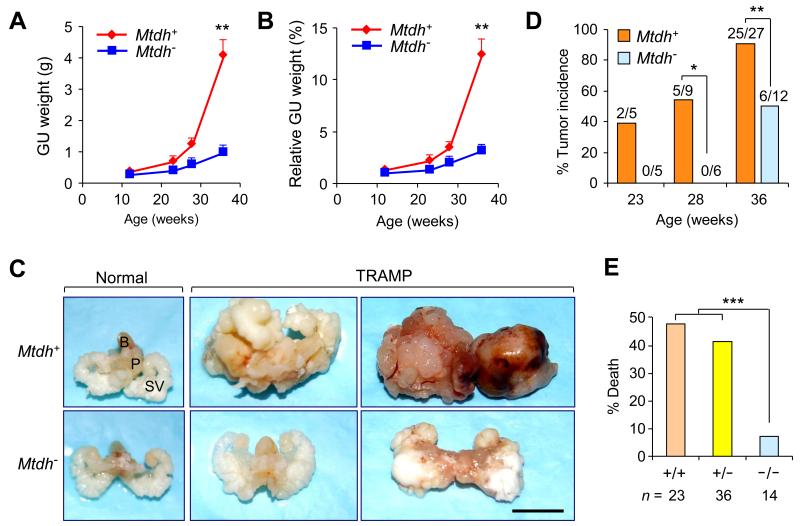
Metadherin (MTDH) overexpression in diverse cancer types has been linked to poor clinical outcomes, but definitive genetic proof of its contributions to cancer remains incomplete. In particular, the degree to which MTDH may contribute to malignant progression in vivo is lacking. Here, we report that MTDH is amplified frequently in human prostate cancers where its expression levels are tightly correlated with prostate cancer progression and poor disease-free survival. Furthermore, we show that genetic ablation of MTDH in the transgenic adenomcarcinoma of mouse prostate (TRAMP) transgenic mouse model of prostate cancer blocks malignant progression without causing defects in the normal development of the prostate. Germline deletion of Mtdh in TRAMP mice prolonged tumor latency, reduced tumor burden, arrested progression of prostate cancer at well-differentiated stages, and inhibited systemic metastasis to distant organs, thereby decreasing cancer-related mortality ∼10-fold. Consistent with these findings, direct silencing of Mtdh in prostate cancer cells decreased proliferation in vitro and tumor growth in vivo, supporting an epithelial cell-intrinsic role of MTDH in prostate cancer. Together, our findings establish a pivotal role for MTDH in prostate cancer progression and metastasis and define MTDH as a therapeutic target in this setting. Cancer Res; 74(18); 5336-47. ©2014 AACR.


Figures

Figure 1
Figure 1. MTDH levels are associated with tumor progression and metastasis in human prostate cancer
Two prostate tumor tissue microarrays were stained with an anti-MTDH antibody. MTDH levels were scored as negative (0), low (1), medium (2) or high (3). A, Representative images of MTDH immunostaining of prostate tissue of different stages and distant metastasis. Scale bar, 40 μm. B, Left, MTDH expression levels in normal tissues (n = 62) and BPN (n = 10), PIN (n = 10), primary tumors (n = 72) and distant metastasis (n = 10). P < 0.001 by Chi-square test. Right, MTDH levels in PIN (n = 10) and BPH (n = 10). P = 0.023 by Chi-square test. C, Correlation of MTDH levels with prostate tumor Gleason scores. Blue curve represents average MTDH score (mean ± SEM) and red curve represents the percentage of samples with medium/high levels of MTDH within indicated groups. D. Kaplan-Meier analysis of recurrence-free survival of prostate cancer patients based on MTDH expression in their tumors.
Figure 2
Figure 2. MTDH genomic gain is associated with MTDH protein levels and clinical progression in prostate cancer
A, A prostate tumor tissue microarray was analyzed for MTDH genomic copy number by FISH. Shown are examples of tumors without (left) or with (right) MTDH genomic gains. SpectrumGreen (green) and SpectrumOrange (pale orange) probes detect chromosome 8 centromere and the 8q22 region, respectively. Scale bar, 1 μm. B, MTDH genomic gain is correlated with MTDH protein levels. Samples with MTDH gain, n = 11; samples without MTDH gain, n = 64. P = 0.0018 by Chi-square test. C, Frequency of MTDH genomic gain in prostate non-cancerous tissues or tumors. normal/benign/premalignant, n = 38; primary tumors, n = 29; distant metastasis, n = 8. P values by Chi-square test are shown. D, Kaplan-Meier analysis of recurrence-free survival of prostate cancer patients with and without MTDH genomic gain in their tumors. Cox proportional hazard ratio (HR) is shown.
Figure 3
Figure 3. Generation and characterization of TRAMP mice with different Mtdh status
A, Cross scheme for the generation of TRAMP mice in C57BL/6 background with different Mtdh status. B, Genotyping of mice generated in (A). Top, the detected WT (602 bp) and gene-trapped mutant alleles (472 bp) of Mtdh. Bottom, the detected TRAMP transgene (600 bp) and internal genomic control (324 bp). C, Mtdh mRNA in prostate tissues from mice with indicated genotypes analyzed by qPCR. Mtdh mRNA was undetectable in Mtdh−/− tissues, and elevated in TRAMP-positive prostate tissues as compared to normal glands. ** P < 0.01, *** P < 0.001 based on Mann-Whitney test. D, Western blot analysis of Mtdh in prostates from WT non-transgenic mice and tumors from TRAMP/Mtdh+/+ mice. Arbitrary levels of Mtdh protein after normalized to β-actin are shown at the bottom. E-F, Representative immunohistochemical staining of SV40 Tag oncoprotein in prostate glands from 8- (E) and 28-week-old (F) TRAMP/Mtdh+/+ and TRAMP/Mtdh−/− mice. Scale bar, 50 μm.
Figure 4
Figure 4. Loss of Mtdh in mice inhibits tumor formation, reduces tumor burden and increases survival rate
A-B, Wet weight (A) or relative weight as % of body weight (B) of lower urogenital tracts excised from TRAMP/Mtdh+/+ and TRAMP/Mtdh+/− mice (denoted as Mtdh+) or TRAMP/Mtdh−/− (denoted as Mtdh). Data represent mean ± SEM. ** P <0.01 based on Mann-Whitney test. C, Representative images of lower urogenital tracts (B, bladder; P, prostate; SV, seminal vesicle) excised from 36-week-old male mice with indicated genotypes. Scale bar, 1 cm. D, Tumor incidence scored by examining histological sections of prostate glands from cohorts of TRAMP mice with indicated Mtdh genotype at different ages. The numbers on top of each bar graph indicates the number of mice with prostate cancer versus total number of mice examined in a given group. *P < 0.05 and ** P < 0.01 based on Chi-square test. E, Mortality rate of TRAMP mice with indicated Mtdh genotypes by one year of age. *** P < 0.001 based on Chi-square test.
Figure 5
Figure 5. Loss of Mtdh inhibits malignant progression of prostate cancer
A, H&E-stained histologic sections of prostates dissected from TRAMP/Mtdh+ and TRAMP/Mtdh mice at indicated ages. Scale bar: 200 μm. B, Each prostate from mice with indicated genotypes and ages was assigned a single highest grade. ‘+’ and ‘−’ indicate TRAMP/Mtdh+ and TRAMP/Mtdh mice, respectively. Grade scores: 1, normal; 2, low grade PIN; 3, high-grade PIN; 4, well differentiated adenocarcinoma and phyllode tumor; 5, moderately differentiated adenocarcinoma; 6, poorly differentiated adenocarcinoma and neuroendocrine tumors. The grading scheme followed standard protocol as previously described (23). The numbers at the bottom of each column indicate total number of prostate glands evaluated in each group. P < 0.05 by Chi-square test in T36 group. C, Analysis of E-cadherin during prostate tumor progression. Sections from dorsal-lateral lobes were immunostained with an antibody against E-cadherin and images shown are representative of n > 3 animals per group. Scale bar: 25 μm. D, (Left) representative images of Ki67-stained sections of prostate tumors from 36-week-old TRAMP/Mtdh+ (n = 6) and TRAMP/Mtdh (n = 3) mice. Scale bars: 25 μm. (Right), quantification of Ki67-positive epithelial cells. Data represent mean ± SEM. **P < 0.01 based on Student’s t-test.
Figure 6
Figure 6. Ablation of Mtdh reduces systemic metastasis of prostate cancer
A, Incidence of lung, liver and lymph node metastasis in cohorts of one-year-old TRAMP mice with indicated Mtdh genotypes. P values based on Chi-square test. B, Bar graph presentation of (A). C and D, Images (C, scale bar 1cm) and H&E-stained sections (D, scale bar 200 μm) of livers and lungs from mice in (A). E, (Left) representative immunohistochemical staining of SV40 T antigen oncoprotein in liver, lung and lymph node metastases. (Right), IgG control on a section of lymph node metastases. Scale bar: 50 μm.
Figure 7
Figure 7. Silencing of Mtdh in TRAMP-C1 prostate cancer cells decreases proliferation in vitro and tumor formation in vivo
A-B, Mtdh was knocked down by two independent shRNA, as quantified by qPCR (A) and western blot (B). C, Proliferation rate of control and Mtdh-KD TRAMP-C1 cancer cells after 48 hours. D, Kinetics of prostate tumor onset in male mice subcutaneously transplanted with control (n = 16), Mtdh-KD1 (n = 8) and Mtdh-KD2 (n = 12) TRAMP-C1 cells. P value based on log-rank test. See also repeat experiments in Fig. S5. E, Tumor volumes 5 weeks post injection in (D). ***P < 0.001 based on Mann-Whitney test. F, Images of tumors dissected 5 weeks post transplantation in (D). G, Mtdh mRNA levels in tumors formed in control and KD groups. Note the tumors that eventually grew in the KD groups expressed similar levels of Mtdh as the controls. (A, C, G) Data represent mean ± SEM and P values based on Student’s t-test. ** P < 0.01, *** P < 0.001, n.s. not significant.

References

    1. Siegel R, Naishadham D, Jemal A. Cancer statistics, 2013. CA: a cancer journal for clinicians. 2013;63:11–30. - PubMed
    1. Hess KR, Varadhachary GR, Taylor SH, Wei W, Raber MN, Lenzi R, et al. Metastatic patterns in adenocarcinoma. Cancer. 2006;106:1624–33. - PubMed
    1. Hu G, Chong RA, Yang Q, Wei Y, Blanco MA, Li F, et al. MTDH activation by 8q22 genomic gain promotes chemoresistance and metastasis of poor-prognosis breast cancer. Cancer Cell. 2009;15:9–20. - PMC - PubMed
    1. Sarkar D, Fisher PB. AEG-1/MTDH/LYRIC: clinical significance. Advances in cancer research. 2013;120:39–74. - PMC - PubMed
    1. Emdad L, Das SK, Dasgupta S, Hu B, Sarkar D, Fisher PB. AEG-1/MTDH/LYRIC: signaling pathways, downstream genes, interacting proteins, and regulation of tumor angiogenesis. Advances in cancer research. 2013;120:75–111. - PMC - PubMed

Publication types