

Accurate determination of blood-brain barrier permeability using dynamic contrast-enhanced T1-weighted MRI: a simulation and in vivo study on healthy subjects and multiple sclerosis patients
- PMID: 25074746
- PMCID: PMC4269724
- DOI: 10.1038/jcbfm.2014.126
Accurate determination of blood-brain barrier permeability using dynamic contrast-enhanced T1-weighted MRI: a simulation and in vivo study on healthy subjects and multiple sclerosis patients
Abstract
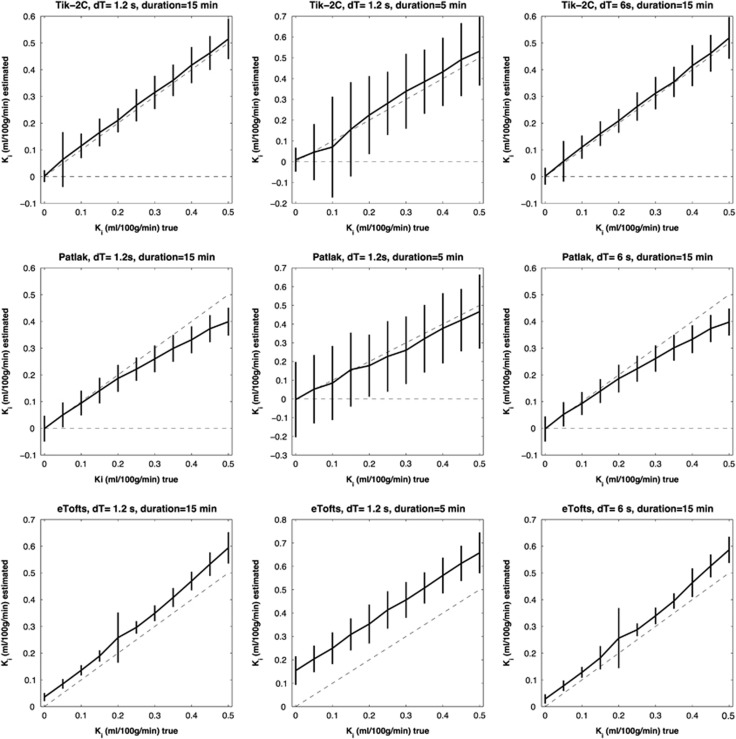
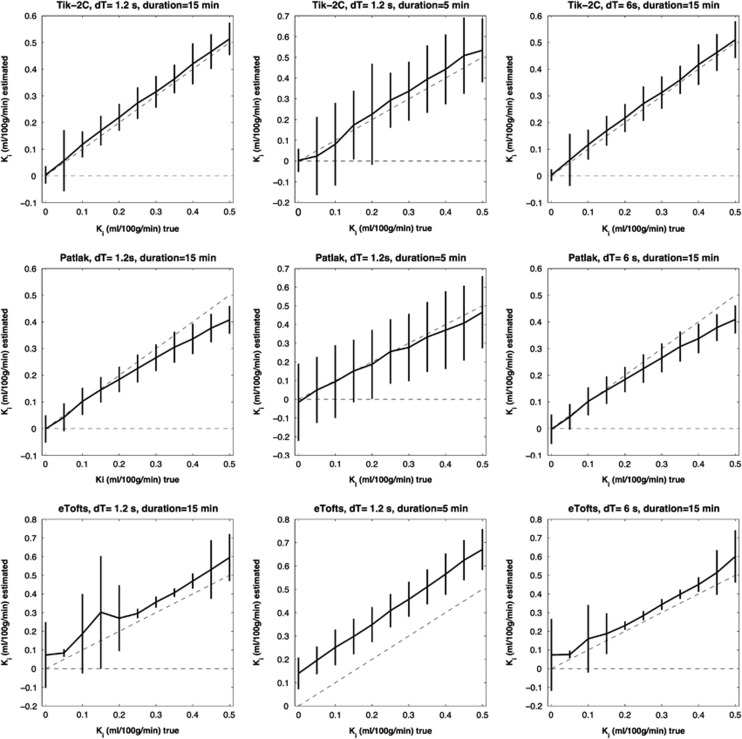
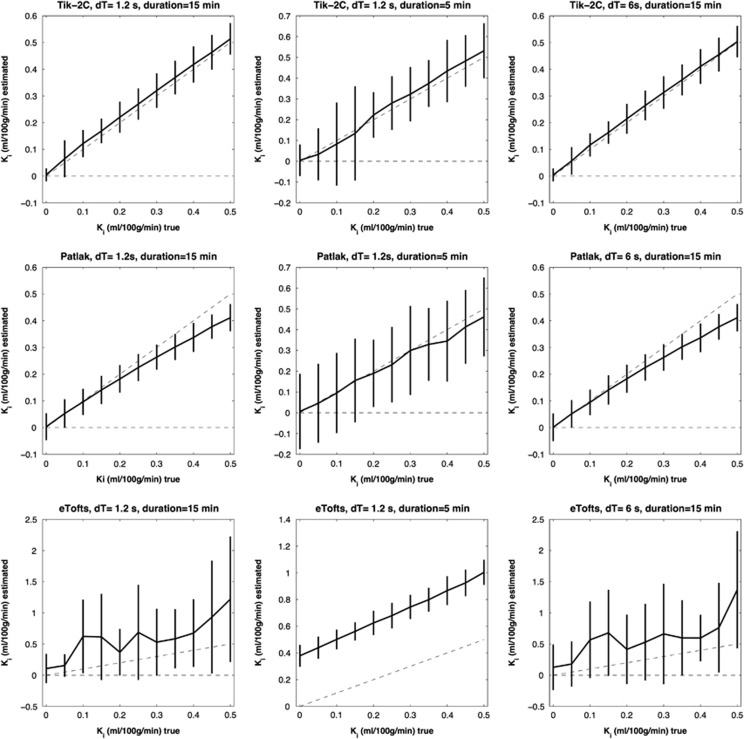
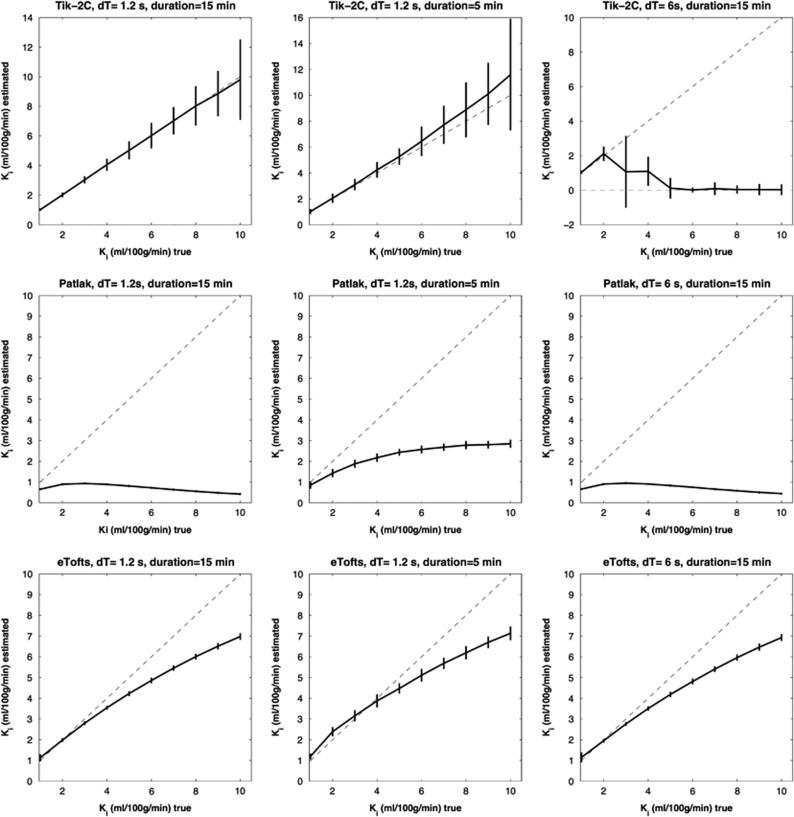
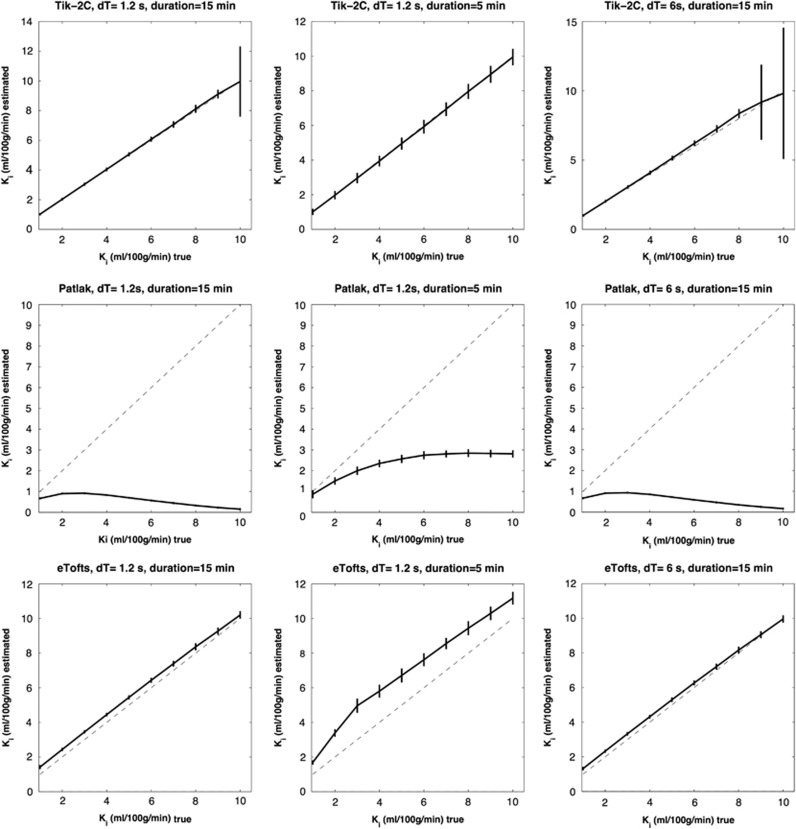
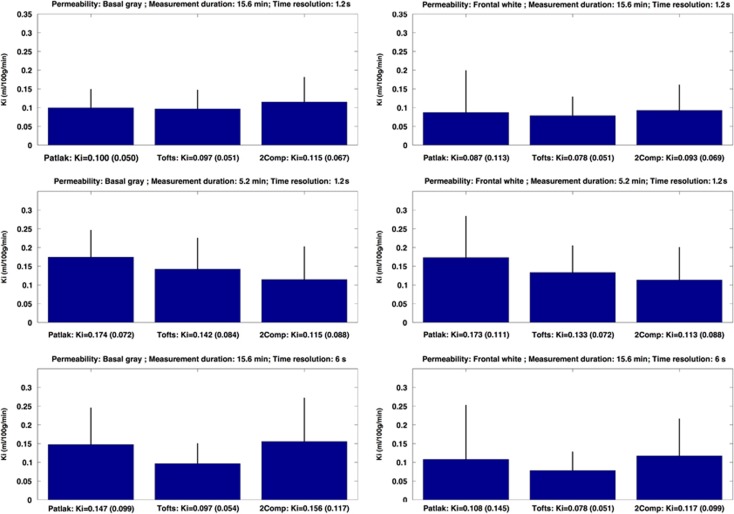
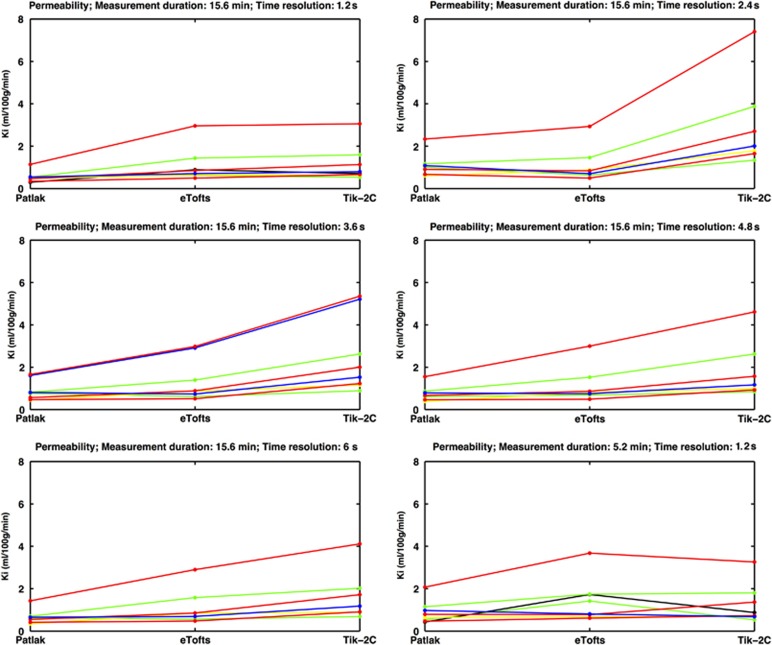
Dynamic contrast-enhanced magnetic resonance imaging (DCE-MRI) is increasingly used to estimate permeability in situations with subtle blood-brain barrier (BBB) leakage. However, the method's ability to differentiate such low values from zero is unknown, and no consensus exists on optimal selection of total measurement duration, temporal resolution, and modeling approach under varying physiologic circumstances. To estimate accuracy and precision of the DCE-MRI method we generated simulated data using a two-compartment model and progressively down-sampled and truncated the data to mimic low temporal resolution and short total measurement duration. Model fit was performed with the Patlak, the extended Tofts, and the Tikhonov two-compartment (Tik-2CM) models. Overall, 17 healthy controls were scanned to obtain in vivo data. Long total measurement duration (15 minutes) and high temporal resolution (1.25 seconds) greatly improved accuracy and precision for all three models, enabling us to differentiate values of permeability as low as 0.1 ml/100 g/min from zero. The Patlak model yielded highest accuracy and precision for permeability values <0.3 ml/100 g/min, but for higher values the Tik-2CM performed best. Our results emphasize the importance of optimal parameter setup and model selection when characterizing low BBB permeability.
Figures
References
-
- Larsson HB, Stubgaard M, Frederiksen JL, Jensen M, Henriksen O, Paulson OB. Quantitation of blood-brain barrier defect by magnetic resonance imaging and gadolinium-DTPA in patients with multiple sclerosis and brain tumors. Magn Reson Med. 1990;16:117–131. - PubMed
-
- Tofts PS, Kermode AG. Measurement of the blood-brain barrier permeability and leakage space using dynamic MR imaging. 1. Fundamental concepts. Magn Reson Med. 1991;17:357–367. - PubMed
-
- Tofts PSP, Brix GG, Buckley DLD, Evelhoch JLJ, Henderson EE, Knopp MVM, et al. Estimating kinetic parameters from dynamic contrast-enhanced T(1)-weighted MRI of a diffusable tracer: standardized quantities and symbols. J Magn Reson Imaging. 1999;10:223–232. - PubMed
-
- Sourbron SP, Buckley DL. On the scope and interpretation of the Tofts models for DCE-MRI. Magn Reson Med. 2011;66:735–745. - PubMed
-
- Luypaert R, Sourbron S, de Mey J. Validity of perfusion parameters obtained using the modified Tofts model: a simulation study. Magn Reson Med. 2010;65:1491–1497. - PubMed
Publication types
MeSH terms
LinkOut - more resources
Full Text Sources
Other Literature Sources
Medical
