. 2014 Aug 12;111(32):E3297-305.
doi: 10.1073/pnas.1400062111. Epub 2014 Jul 29.

Origin of myofibroblasts in the fibrotic liver in mice

Affiliations

Origin of myofibroblasts in the fibrotic liver in mice

Keiko Iwaisako et al. Proc Natl Acad Sci U S A. .

Abstract

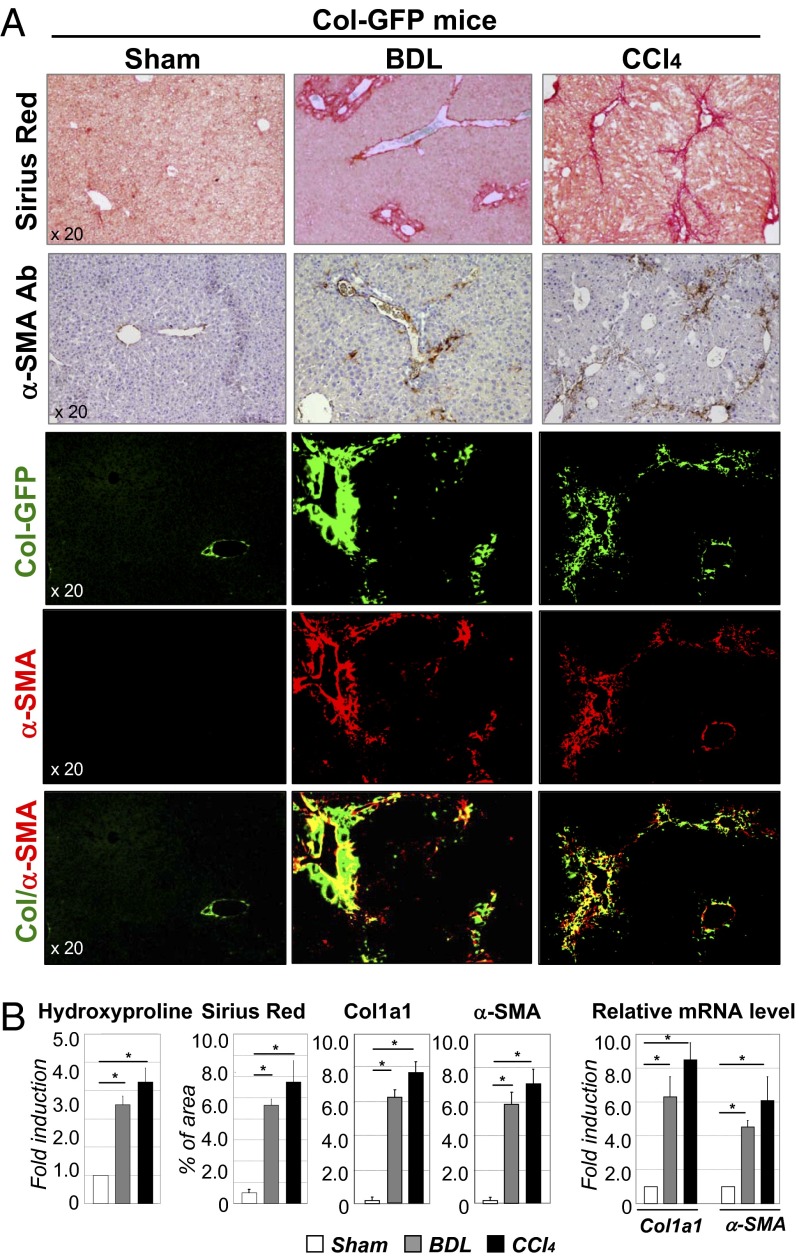
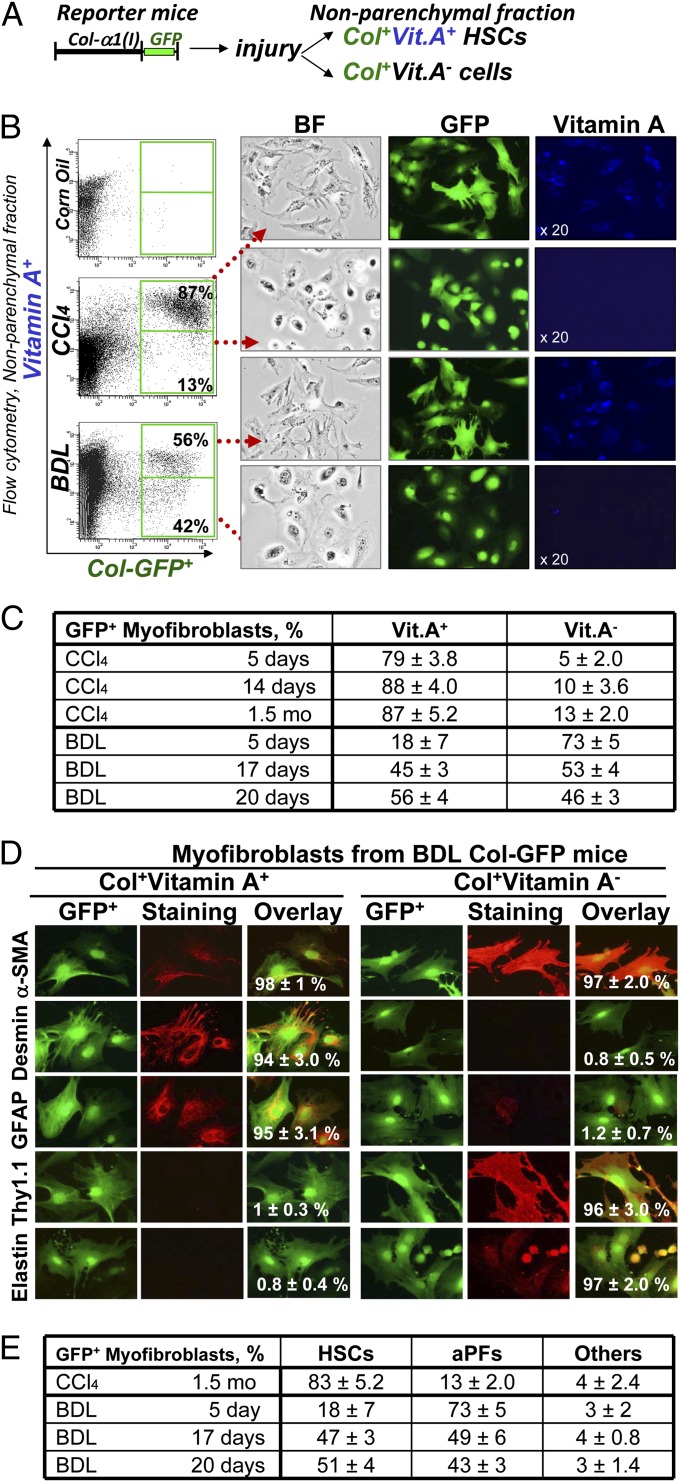
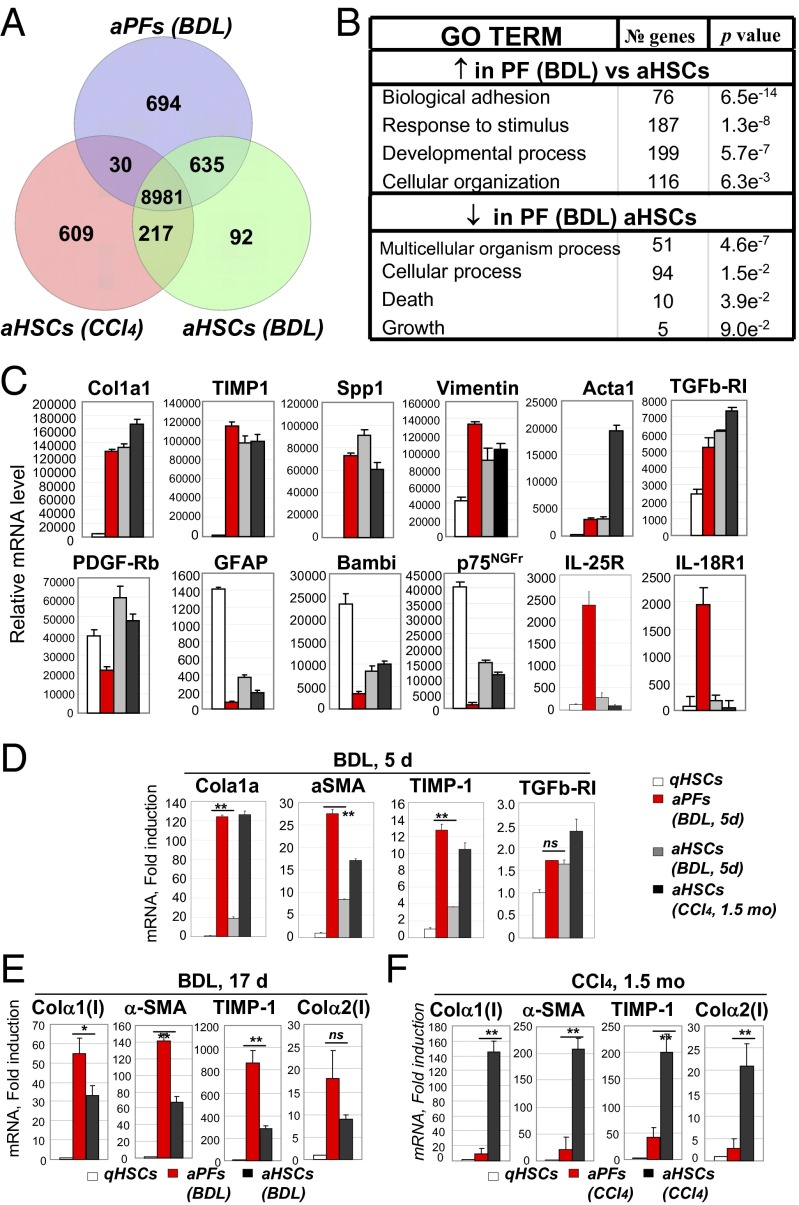
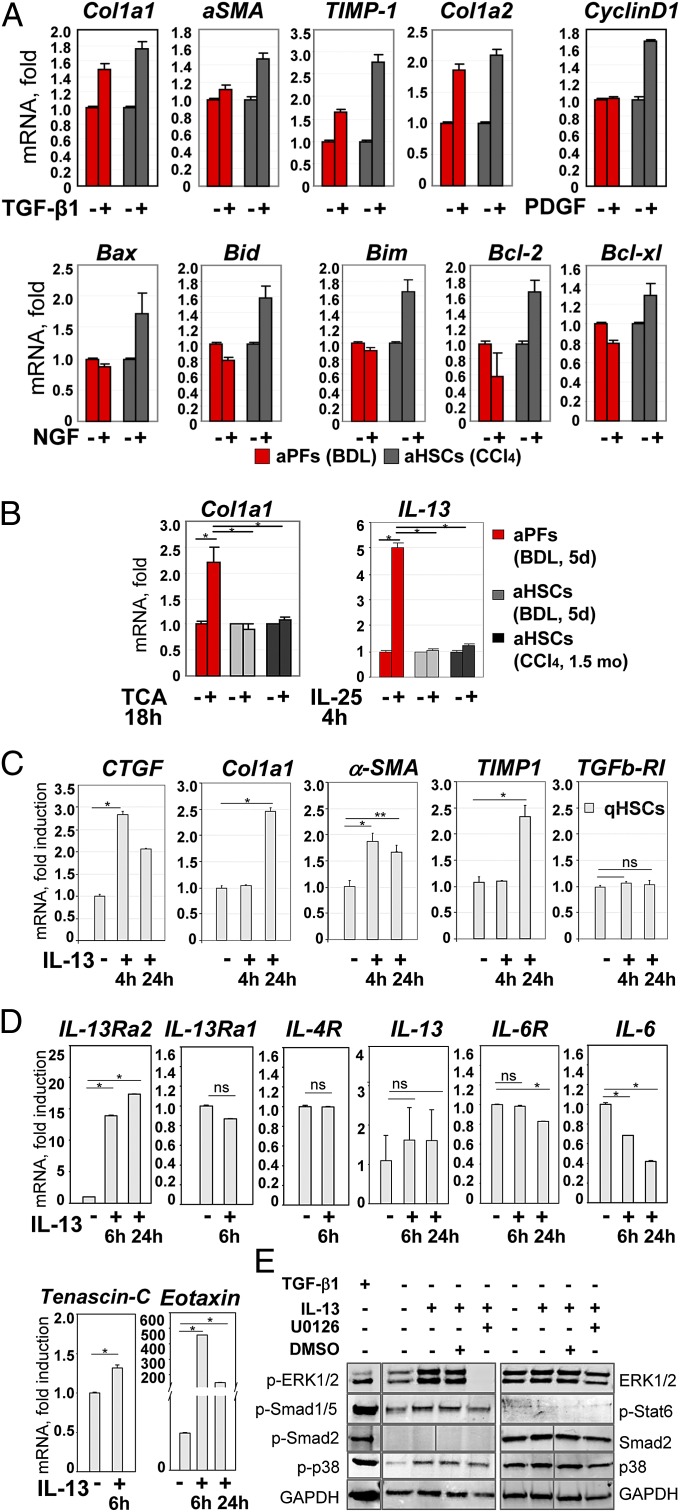
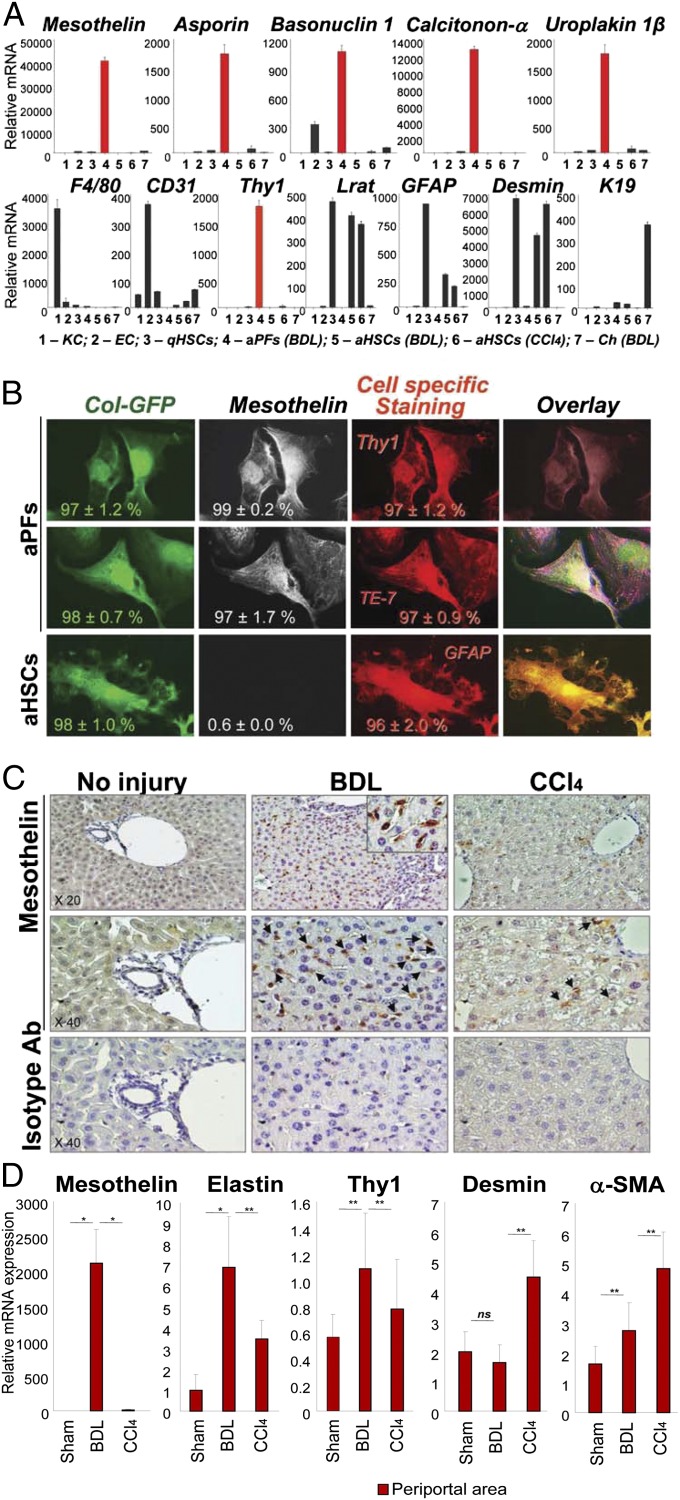
Hepatic myofibroblasts are activated in response to chronic liver injury of any etiology to produce a fibrous scar. Despite extensive studies, the origin of myofibroblasts in different types of fibrotic liver diseases is unresolved. To identify distinct populations of myofibroblasts and quantify their contribution to hepatic fibrosis of two different etiologies, collagen-α1(I)-GFP mice were subjected to hepatotoxic (carbon tetrachloride; CCl4) or cholestatic (bile duct ligation; BDL) liver injury. All myofibroblasts were purified by flow cytometry of GFP(+) cells and then different subsets identified by phenotyping. Liver resident activated hepatic stellate cells (aHSCs) and activated portal fibroblasts (aPFs) are the major source (>95%) of fibrogenic myofibroblasts in these models of liver fibrosis in mice. As previously reported using other methodologies, hepatic stellate cells (HSCs) are the major source of myofibroblasts (>87%) in CCl4 liver injury. However, aPFs are a major source of myofibroblasts in cholestatic liver injury, contributing >70% of myofibroblasts at the onset of injury (5 d BDL). The relative contribution of aPFs decreases with progressive injury, as HSCs become activated and contribute to the myofibroblast population (14 and 20 d BDL). Unlike aHSCs, aPFs respond to stimulation with taurocholic acid and IL-25 by induction of collagen-α1(I) and IL-13, respectively. Furthermore, BDL-activated PFs express high levels of collagen type I and provide stimulatory signals to HSCs. Gene expression analysis identified several novel markers of aPFs, including a mesothelial-specific marker mesothelin. PFs may play a critical role in the pathogenesis of cholestatic liver fibrosis and, therefore, serve as an attractive target for antifibrotic therapy.

Keywords: ECM deposition; markers of fibrogenic myofibroblasts.


Conflict of interest statement

The authors declare no conflict of interest.

Figures

Fig. 1.
Fig. 1.
Development of liver fibrosis in Col-GFP mice in response to BDL and CCl4. (A) CCl4-treated and BDL-operated mice (but not sham mice, 8-wk-old, n = 10 per group) developed liver fibrosis, as shown by Sirius Red staining, fluorescent microscopy for collagen-GFP, and staining for α-SMA (20× objective). (B) Fibrosis was assessed by hydroxyproline and Sirius Red (positive area) content and by mRNA levels of fibrogenic genes (Col and α-SMA) in all groups of mice is shown, *P < 0.003; **P < 0.001.
Fig. 2.
Fig. 2.
Detection, quantification, and isolation of liver myofibroblasts. (A) Strategy to analyze myofibroblasts by flow cytometry: Collagen type I-expressing myofibroblasts were identified in nonparenchymal fraction by GFP expression and further fractionated to Vit.A+ and Vit.A cells. (B) FACS analysis of nonparenchymal fraction from untreated and BDL-, and CCl4- treated Col-GFP mice: GFP+ cells were detected by argon laser at 488 nm wavelength, and Vit.A+ cells were detected by violet laser at 405 nm wavelength. Representative dot plots are shown, P < 0.03. GFP+Vit.A+ and GFP+Vit.A cells were sort purified and analyzed by light and fluorescent microscopy for GFP and Vitamin A expression (UV laser, 20× objective). (C) Flow cytometry-based quantification of GFP+ myofibroblasts. Expression of vitamin A in GFP+ cells was analyzed in nonparenchymal fraction of Col-GFP mice at different time points (n = 6 per time point) of CCl4 and BDL, P < 0.01. (D) Immunophenotyping of GFP+ myofibroblasts isolated from BDL mice. GFP+Vit.A+ and GFP+Vit.A fractions were sort purified from Col-GFP mice (n = 6) after BDL (20 d). Expression of myofibroblast marker (α-SMA), HSC markers (desmin, GFAP, CD146), and PF markers (elastin, Thy1) were analyzed by immunocytochemistry using specific antibodies or isotype matched controls (40× objective). GFP+Vit.A+ and GFP+Vit.A cells were identified as aHSCs and aPFs, respectively. For each fraction, the percent of positively stained cells is calculated (compared with total cells, 100%, P < 0.05). (E) Quantification of GFP+Vit.A+ and GFP+Vit.A fractions is based on expression of HSC- and PF-specific markers in GFP+ myofibroblasts (100%) as detected by immunocytochemistry, P < 0.05.
Fig. 3.
Fig. 3.
Characterization of aPFs and aHSCs. (A) BDL (20 d) GFP+Vit.A aPFs and GFP+Vit.A+ aHSCs were analyzed by the whole mouse genome microarray, and their gene expression profile was compared with that in CCl4-activated GFP+Vit.A+ HSCs. Venn diagrams of the cell group-enriched genes that exhibited more than a twofold up-regulation compared with other groups. (B) GO TERM: demonstrates the signaling pathways that were up-regulated or down-regulated in BDL-aPFs versus BDL- or CCl4-aHSCs. (C) Expression of selected genes in qHSCs, BDL-aHSCs and BDL-aPFs, and CCl4-aHSCs. The results are relative mRNA level (average of normalized values/multiple probes/per gene) obtained by Agilant microarray, P < 0.001. (D) Expression of fibrogenic genes was analyzed by RT-PCR in BDL- (5 d) aPFs and BDL-aHSCs, isolated from the same mice (n = 6), and compared with that in qHSCs-aHSCs and CCl4 (1.5 mo)-aHSCs. The data are shown as fold induction compared with qHSCs, **P < 0.02 is shown for BDL-aPFs and BDL-aHSCs; ns is not significant. (E) Expression of fibrogenic genes was analyzed in BDL (17 d)-aPFs and BDL-aHSCs (isolated from the same mice, n = 6) by RT-PCR vs. qHSCs. The data are shown as fold induction compared with qHSCs, *P < 0.05; **P < 0.01; ns, nonsignificant. (F) Similarly, CCl4- (1.5 mo)aPFs and CCl4-aHSCs, isolated from the same mice (n = 4) were analyzed by RT-PCR. The data are shown as fold induction over qHSCs, *P < 0.05; **P < 0.01. The data in DF represent at least three independent experiments.
Fig. 4.
Fig. 4.
Functional properties of aPFs and aHSCs. (A) Response to cytokines was compared in BDL-aPFs and CCl4-aHSCs. Both aHSCs and aPFs responded to TGF-β1 (10 ng/mL). aHSCs, but not aPFs, responded to PDGF (100 pg/mL) and NGF (100 ng/mL). The data are fold induction compared with untreated aPFs (or aHSCs), P < 0.01. (B) BDL-aPFs (but not BDL-aHSCs or CCl4-aHSCs) responded to bile acid taurocholic acid (TCA; 1,200 nmol/mL) by up-regulation of Col1a1, and to IL-25 (100 ng/mL) by IL-13 secretion, P < 0.05. Stimulation of aPFs with Tauro-ursodeoxycholate (TUDCA; 25 nmol/mL), deoxycholic acid (DCA; 0.1 nmol/mL), taurochenodeoxycholate (TCDCA; 60 nmol/mL), Tauro b-muricholate (TbMCA; 2,000 nmol/mL), and cholic acid (CA; 20 nmol/mL) did not result in Col1a1 induction. The data are fold induction compared with untreated aPFs (or aHSCs), *P < 0.05. (C) The effect of IL-13 on HSC activation was evaluated. qHSCs were incubated with IL-13 (100 ng/mL) for 4 h and 24 h. Gene expression was evaluated by RT-PCR, *P < 0.01; **P < 0.02; ns, nonsignificant. The data (AC) represent three independent experiments. For each experiment, the cells were isolated from three mice. (D) IL-13 signaling in mouse HSCs: IL-13–stimulated HSCs (100 ng/mL, 6 h) up-regulate IL-13Rα2, tenascin C, and eotaxin, but do not express IL-13 or IL-6, as shown by RT-PCR. (E) IL-13 signaling in HSCs (2 h) causes phosphorylation of ERK1/2 (which is blocked by ERK inhibitor U0126, 10 μM), p38, and Smad1/5, as shown by Western blot. TGF-β1–stimulated HSCs served as a control.
Fig. 5.
Fig. 5.
Expression of mesothelin in aPFs is associated with cholestatic liver fibrosis in mice. (A) Expression of selected signature genes was compared by RT-PCR in aPFs and other cells in the liver. Mesothelin, asporin, basonuclin 1, calcitonin-α, and uroplakin 1β mRNA were up-regulated in BDL- (17 d) aPFs, but not in KC, endothelial cells (EC), BDL- and CCl4-aHSCs and qHSCs, or BDL-induced cholangiocytes (Ch). The purity of each fraction was estimated by expression of F4/80 in KC, CD31 in EC, Lrat, GFAP, and Desmin in HSCs, Thy1 in aPFs, and K19 in cholangiocytes. The data (from three independent experiments) are shown as relative mRNA expression, P < 0.01. (B) aPFs and aHSCs were isolated from BDL (17 d)-injured Col-GFP mice and stained with anti-mesothelin Ab. Expression of Mesothelin was detected only in aPFs (but not in GFAP+ aHSCs) and colocalized with Elastin (TE-7) and Thy1 staining. The percent of immunostained cells is calculated, P < 0.05 (four independent experiments; Fig. S7B). (C) Paraffin sections of liver tissue from BDL- (17 d) or CCl4- (1.5 mo)treated mice (n = 4 per group) were immunostained with anti-mesothelin antibody or isotype-matched control. Expression of mesothelin was detected in BDL mice but not in sham-operated mice. Only a few mesothelin positive cells were detected in CCl4-treated mice. Representative images are shown using 20× and 40× objective, (Fig. S7C). (D) Up-regulation of mesothelin is detected by laser capture microdissection in BDL-induced (but not CCl4-induced) liver fibrosis. Laser capture microdissection was used to isolate periportal myofibroblasts from BDL (20 d) mice and CCl4 (1.5 mo)-treated mice (n = 3 per group), cells were analyzed by RT-PCR for expression of aPF- and aHSC-specific markers. Mesothelin, elastin, and Thy1 were highly expressed in myofibroblasts obtained from periportal area of BDL liver. Desmin was expressed at high levels in CCl4-treated liver. Unlike desmin, mesothelin was not expressed in CCl4-treated periportal area. The data (from three independent experiments) are mRNA fold induction compared with periportal area of sham mice, *P < 0.01; **P < 0.05; ns, nonsignificant.

References

    1. Bataller R, Brenner DA. Liver fibrosis. J Clin Invest. 2005;115(2):209–218. - PMC - PubMed
    1. Forbes SJ, Parola M. Liver fibrogenic cells. Best Pract Res Clin Gastroenterol. 2011;25(2):207–217. - PubMed
    1. Kisseleva T, et al. Bone marrow-derived fibrocytes participate in pathogenesis of liver fibrosis. J Hepatol. 2006;45(3):429–438. - PubMed
    1. Kisseleva T, et al. Fibrocyte-like cells recruited to the spleen support innate and adaptive immune responses to acute injury or infection. J Mol Med (Berl) 2011;89(10):997–1013. - PMC - PubMed
    1. Scholten D, et al. Migration of fibrocytes in fibrogenic liver injury. Am J Pathol. 2011;179(1):189–198. - PMC - PubMed

Publication types

MeSH terms