. 2014 Aug 12;111(32):E3287-96.
doi: 10.1073/pnas.1321640111. Epub 2014 Jul 29.

p53Ψ is a transcriptionally inactive p53 isoform able to reprogram cells toward a metastatic-like state

Affiliations

p53Ψ is a transcriptionally inactive p53 isoform able to reprogram cells toward a metastatic-like state

Serif Senturk et al. Proc Natl Acad Sci U S A. .

Abstract

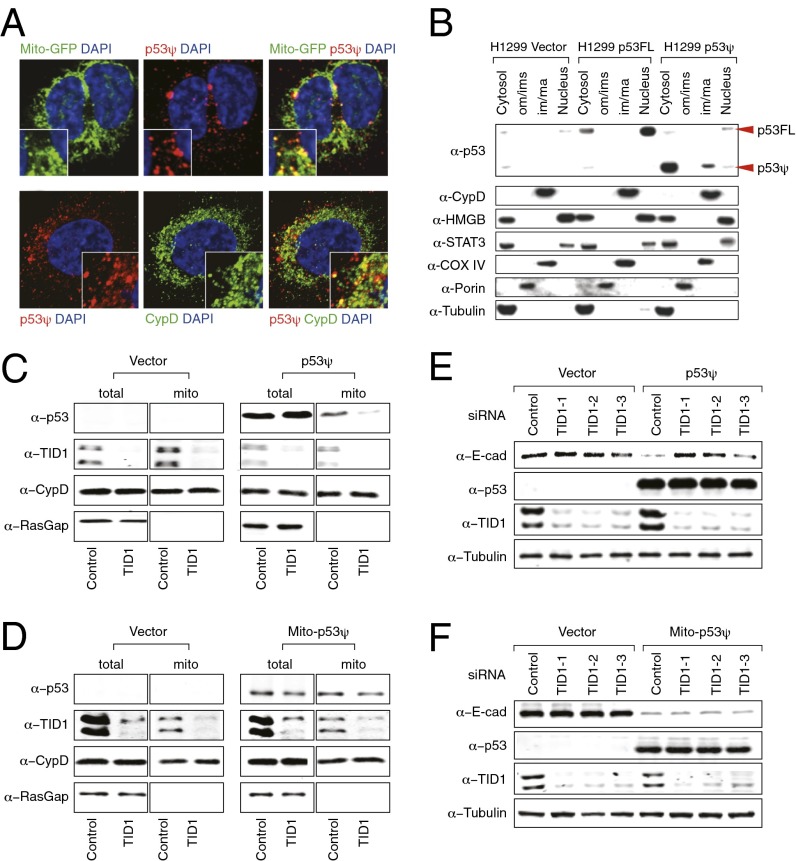
Although much is known about the underlying mechanisms of p53 activity and regulation, the factors that influence the diversity and duration of p53 responses are not well understood. Here we describe a unique mode of p53 regulation involving alternative splicing of the TP53 gene. We found that the use of an alternative 3' splice site in intron 6 generates a unique p53 isoform, dubbed p53Ψ. At the molecular level, p53Ψ is unable to bind to DNA and does not transactivate canonical p53 target genes. However, like certain p53 gain-of-function mutants, p53Ψ attenuates the expression of E-cadherin, induces expression of markers of the epithelial-mesenchymal transition, and enhances the motility and invasive capacity of cells through a unique mechanism involving the regulation of cyclophilin D activity, a component of the mitochondrial inner pore permeability. Hence, we propose that p53Ψ encodes a separation-of-function isoform that, although lacking canonical p53 tumor suppressor/transcriptional activities, is able to induce a prometastatic program in a transcriptionally independent manner.

Keywords: cancer; reactive oxygen species.


Conflict of interest statement

The authors declare no conflict of interest.

Figures

Fig. 1.
Fig. 1.
Expression of p53ψ, a unique p53 isoform generated by the use of an alternative 3′ splice site, is enriched in CD44high/CD24low cells. (A) Schematic of naphthalene lung injury model. (B) Lung cell suspensions were sorted by FACS at different time points after injury with naphthalene. CD31- and CD45-negative cells were used to remove endothelial cells and bone marrow-derived cells, respectively. (Right) Accumulation of CD44high/CD24low cells over 21 d. Values in the right upper corners represent percentage of CD44high/CD24low cells relative to CD31/CD45 cells. (C) The table reports expression of multiple p53 targets in CD44low/CD24high (CD44L) cells sorted from naphthalene-injured mice compared with levels in CD44high/CD24low (CD44H) cells. (D) RT-PCR analysis of lung tissue extracts obtained at the indicated time points after naphthalene treatment using oligonucleotide primers to exons 6 and 8 (ex6-ex8; Top) and primers specific for p53ψ (460-ex8; Middle). Actin was used for normalization. (E) Sequence analysis of the two PCR products amplified with p53 primers indicated the use of a unique splice junction between exon 6 and exon 8 in the shorter p53 transcript. (F) RT-PCR analysis of lung tissue obtained after naphthalene treatment at the indicated time points using primers specific for p53FL and p53ψ. (G) RT-PCR analysis of liver tissue after CCL4 treatment using oligonucleotide primers specific for p53FL and the p53ψ isoform at the indicated time points. Analyses of levels of TGF-β and IL-6 were used to confirm tissue injury. See Fig. S2C for further details on primer design. (H) RNA FISH confirmed expression of p53ψ in CCL4-injured livers. Tissue sections were hybridized with RNA FISH probes specific for p53ψ (red) and stained for smooth muscle actin (SMA, green) to highlight damaged area. DAPI (blue) was used as counterstain.
Fig. 2.
Fig. 2.
p53ψ is expressed in tumors and tumor-derived cell lines. (A) Expression of p53Ψ in two representative lung adenocarcinoma tumor cores characterized by high percentages of CD44highCD24low cells (Upper) or CD44lowCD24high cells (Lower). CD44 staining was pseudocolored in green and CD24 is in red. Staining with p53Ψ sense (SE) and antisense (AS) probes are shown in orange. DAPI (blue) as counterstain. See Fig. S2 for details on probe design. (B) The chart represents the distribution of p53Ψ mRNA expression in CD44highCD24low NSCLC tumors. (C) Kaplan–Meyer distribution of p53Ψ-positive and -negative NSCL tumors. See Fig. S2 for further details. (D) Semiquantitative RT-PCR analysis of p53FL and p53ψ in CD44high/CD24low cells sorted from multiple human cancer-derived cell lines. (E) The pie chart represents the distribution of mutations at position c.673–2A in 28,581 tumors as reported in the IARC p53 database. (F) A collection of 172 upper urinary tract transitional carcinoma cases was analyzed for mutations in the TP53 gene. The number of missense mutations (Upper) and mutations predicted to affect the TP53 splicing pattern (Lower) is shown. (G) Schematic of the minigene used in this study. (H) RT-PCR analysis of transcripts from the minigene using primers to the CMV promoter and exon 8 indicated that the presence of a G in position -2 relative to the first nucleotide in exon 7 resulted in the generation of an alternative transcript of the expected size of a p53Ψ-like transcript (PSI). Sequence analysis confirmed that this transcript was the result of the use of the same cryptic acceptor site in intron 6 used for the generation of p53Ψ. (I) RT-PCR analyses of cells expressing p53FL (A549) and a TP53 c.673–2A/G mutation (HOP62) indicate that the latter induces the generation of a p53Ψ-like transcript. Primers to exons 4 and 7 were used for PCR amplification of transcripts. (L) Western blot analysis with an N-terminal p53 antibody (DO1) of A549 and HOP62 cells extracts indicates that the HOP62 cells inherently express a p53Ψ-like protein of the expected size.
Fig. 3.
Fig. 3.
p53ψ is devoid of transcriptional activity. (A) Schematic representation of p53ψ and p53FL. (B) Western blot analysis indicated that in A549 cells ectopic expression of the unique p53 isoform generated a protein of an apparent size of 27 kDa. (C) Immunostaining analysis revealed a predominantly cytoplasmic, partly punctate localization of p53Ψ (green). Phalloidin (red) and DAPI (blue) were used as counterstains to highlight actin fibers and the nucleus, respectively. (D) Subcellular fractionation of A549 cells expressing vector or p53ψ indicates a cytoplasmic distribution of the p53ψ protein isoform. Equal amounts of whole cell lysate (T) and cytoplasmic (C) and nuclear (N) protein fractions were analyzed by Western blotting using an antibody directed against the N-terminal domain of p53 (DO1). Tubulin and uncleaved PARP were used as controls for cytoplasmic and nuclear fractions, respectively. (E) The chart represents expression of known p53 targets (p21, Puma, Tigar) in H1299 cells ectopically expressing vector, p53ψ, and p53FL. mRNA levels were quantified by SYBR green-based real-time RT-PCR in tetracycline inducible p53-null cells (H1299) ectopically expressing p53FL or p53Ψ on induction with doxycycline (0.5 μg/mL) for 5 d. Columns represent relative expression values (P < 0.0001, Student t test). Levels of expression of p53FL and p53Ψ are provided in Fig. 3A. (F) A dual luciferase reporter assay in H1299 cells indicated that ectopic expression of p53ψ fails to activate the synthetic p53-responsive promoter p21Cip1-luc. Luciferase activity was normalized to Renilla activity. Data shown are representative of three independent experiments (P = 0.03241). Cells were treated with doxycycline (0.5 μg/mL) for 3 d before the assay. (G) p53ψ is unable to modify the transcriptional activity of p53FL. Ectopic expression of p53Ψ in cells expressing endogenous p53FL (A549 cells) did not induce expression of known p53 targets. To increase p53 activity cells were treated with the DNA damaging agent doxorubicin for 24 h. The chart represents relative mRNA levels of the indicated p53 targets on treatment with doxorubicin (1 μM). Data shown represent relative (compared with actin) expression levels (mean ± SD, n = 6; P < 0.0001, Student t test) as measured by SYBR green-based real-time PCR. Similar results were observed at steady state (Fig. 3C). Expression levels of p53FL and p53Ψ are provided in Fig. 3C.
Fig. 4.
Fig. 4.
p53Ψ, like certain p53 gain-of-functions mutations, is sufficient to reprogram cells toward the acquisition of prometastatic features. (A) Silencing of p53Ψ in cells inherently and exclusively expressing p53Ψ (HOP62) resulted in loss of mesenchymal-like features and the acquisition of an epithelial morphology. Representative pictures of cells 4 d after transfection with a mixture of two independent siRNA oligonucleotides targeting p53 are shown. Knockdown efficiency is shown as part of the RT-PCR analysis in B. (B) The chart represents qRT-PCR analysis of the canonical EMT markers E-cadherin (ECAD) and vimentin (VIM), as well as the EMT master regulators Slug, Twist, and Zeb1 in HOP62 cells on inhibition of p53 with two different siRNAs. No difference in Snail expression was observed. Data shown represent relative (compared with actin) expression levels (mean ± SD, n = 6; P < 0.0001, Student t test) as measured by SYBR green-based real-time RT-PCR. Note these cells do not express p53FL. (C) Ectopic expression of p53Ψ resulted in the acquisition of morphological features characteristic of cells undergoing EMT. Scanning electron micrographs of representative MCF7 and A549 cells are shown. Level of expression of p53FL and p53Ψ in MCF7are provided in Figs. S4B and S3E, respectively. (D) The chart represents qRT-PCR analysis of the canonical EMT markers E-cadherin (ECAD) and vimentin (VIM), as well as the EMT master regulators Snail, Slug, Twist, and Zeb1 in H1299 cells ectopically expressing p53Ψ or p53FL. Data shown represent relative (compared with actin) expression levels (mean ± SD, n = 6; P < 0.0001, Student t test) as measured by SYBR green-based real-time RT-PCR. (E and F) Expression of p53Ψ in A549 cells leads to increased cell motility and invasion. In E, the percentage of closure of a wound at the indicated time points in a 2D cell monolayer is depicted. Each bar is the average of four individual wounds. The histogram shows the mean value ± SD (P ≤ 0.0001 by Student t test). The invasion potential of cells in F was determined in a standard Matrigel invasion assay. Filter chambers were coated with 40 µL Matrigel and invasion was assessed after 30 h. TGF-β–treated cells were used as a positive control. Motility and invasion were determined in A549 cells after induction for 5 d with doxycycline (0.5 μg/mL).
Fig. 5.
Fig. 5.
Mitochondrial localization of p53Ψ is required for p53ψ-induced epithelial to mesenchymal transition. (A) Immuno-staining analysis of H1299 cells revealed a partial mitochondrial localization of p53Ψ (red). Mitochondrial GFP (pseudocolored in green in Upper) and cyclophilin D (CypD), a mitochondrial matrix protein (pseudocolored in green in Lower) were used as counterstains to highlight the mitochondria. The cell nuclei were stained with DAPI (blue). (B) Western blot analysis of H1299 cells was used to characterize the different submitochondrial fractions, indicating localization of p53Ψ within the inner membrane/matrix fraction (im/ma). CypD and COX IV staining were used to control for purity of the inner membrane/matrix fraction, the high-mobility group box 1 (HMGB) antibody for the nuclear fraction, PORIN antibody for the outer membrane fraction, and TUBULIN antibody for the cytosolic fraction. (C and D) TID-1 is required for localization of p53Ψ in the mitochondria. Biochemical fractionation followed by Western blot analysis was used to analyze the distribution of (C) p53Ψ and (D) mito-p53Ψ on TID-1 knockdown in p53Ψ-expressing A549 cells. At 72 h after transfection with Tid-1–specific siRNA, p53Ψ mitochondiral localization was determined. Analyses of CypD (a mitochondrial matrix protein) and p120 RasGAP (a cytoplasmic protein) localizations were used as controls for purity of the mitochondrial fractions. (E and F) Western blot analysis of protein extracts from A549 cells ectopically expressing (E) p53Ψ and (F) mito-p53Ψ on inhibition of Tid1 expression indicate that Tid-1 is required for p53Ψ-induced reduction of E-cadherin levels.
Fig. 6.
Fig. 6.
p53ψ interaction with cyclophylin D is sufficient to increase the mPTP pore permeability and reactive oxygen production. (A) Immunoprecipitation analysis indicates an interaction between p53Ψ and CypD in the mitochondrial fraction. The mitochondrial fraction of A549 ectopically expressing p53Ψ was immunoprecipitated with a CypD-specific antibody and probed with a p53 N-terminal antibody or as controls with CypD and Smurf1 antibodies. (B) Schematic of calcein AM assay. (C) The pictures depict representative fluorescence microscopy images. A549 cells were loaded with calcein at 10 nM, and fluorescence was detected by laser confocal microscopy after 15 min. Nonmitochondrial calcein fluorescence was quenched by cotreatment with CoCl2. Treatment with the ionophore ionomycin (50 nM) is shown as control. Cyclosporin A (CsA) was used at 2 mM. (D) The bars represent the percentage of drop of calcein fluorescence on quenching of cytosolic calcein with CoCl2 in three independent experiments. Median calcein fluorescence was assessed by FACS. Calcein was loaded at 10 nM and detected at 515 nM after 15 min on excitation with Red HeNe at 495 nM. Treatment with ionomycin was used as control to estimate basal fluorescence. FACS plots are provided in Fig. S6. (E) Representative fluorescence microscopy images of A549 cells loaded with MitoSOX (1 μM). Images show the fluorescence on excitation at 390 nm, mainly from the hydroxyethidium derivative (red). DAPI (blue) was used as a counterstain. (F) The histogram represents the quantification of the MitoSox-positive fractions in three independent FACS experiments from E.
Fig. 7.
Fig. 7.
Cyclophylin D and ROS are required for EMT induction by p53ψ. (A) Western blot analysis of A549 cells ectopically expressing p53Ψ on transfection with two independent siRNA targeting cyclophilin D (CypD). (B) Treatment with CsA, a highly specific and potent pharmacological inhibitor of CypD, is sufficient to restore expression of E-cadherin to a level similar to that observed in control cells and to reduce expression of EMT markers in cells ectopically expressing p53Ψ. The chart represents qRT-PCR analysis of the canonical EMT markers E-cadherin (ECAD) and vimentin (VIM), as well as the EMT master regulators Snail, Slug, Twist, and Zeb1 in H1299 cells ectopically expressing p53Ψ on treatment for 5 d with 2 mM CsA. Data shown represent relative (compared with actin) expression levels (mean ± SD, n = 6; P < 0.0001, Student t test) as measured by SYBR green-based real-time RT-PCR. Similar results were observed in MCF7 cells. (C) The chart represents the motility of A549 cells ectopically expressing p53FL or p53Ψ after treatment for 5 d with CsA. Cell motility was measured in a standard wound healing experiment as previously described. The charts indicate the percentage of closure at 48 h in the presence or absence of 2 mM CsA. Each bar is the average of four individual wounds. The histogram shows the mean value ± SD (P ≤ 0.0001 by Student t test). (D) Treatment with low but increasing concentrations of H2O2 is sufficient to decrease expression of E-cadherin to levels similar to those observed in cell lines ectopically expressing p53Ψ. mRNA levels of E-cadherin were assessed by SYBR green-based real-time RT-PCR on treatment for 5 d with H2O2. Data shown represent relative expression compared with vector (mean ± SD, n = 6; P < 0.0001, Student t test). (E) Reduction of ROS levels is sufficient to enhance expression of E-cadherin levels in cells expressing p53Ψ. Cells were treated for 5 d with 10 mM NAC. Similar results were obtained in cells treated with Tempol, another ROS scavenger (Fig. S6C). (F) Schematic of proposed mechanism to explain p53Ψ-induced EMT. On acute oxidative stress, p53FL was previously shown to interact with CypD and trigger necrotic cell death by opening mPTP pore (Vaseva Cell 2012, Left).

Comment in

Similar articles

Cited by

References

    1. Junttila MR, Evan GI. p53—A Jack of all trades but master of none. Nat Rev Cancer. 2009;9(11):821–829. - PubMed
    1. Hu W, Feng Z, Teresky AK, Levine AJ. p53 regulates maternal reproduction through LIF. Nature. 2007;450(7170):721–724. - PubMed
    1. Aldaz CM, et al. Serial analysis of gene expression in normal p53 null mammary epithelium. Oncogene. 2002;21(41):6366–6376. - PubMed
    1. Matoba S, et al. p53 regulates mitochondrial respiration. Science. 2006;312(5780):1650–1653. - PubMed
    1. Meletis K, et al. p53 suppresses the self-renewal of adult neural stem cells. Development. 2006;133(2):363–369. - PubMed

MeSH terms