. 2014 Sep 12;289(37):25976-86.
doi: 10.1074/jbc.M114.576058. Epub 2014 Jul 29.

Adropin is a brain membrane-bound protein regulating physical activity via the NB-3/Notch signaling pathway in mice

Affiliations

Adropin is a brain membrane-bound protein regulating physical activity via the NB-3/Notch signaling pathway in mice

Chi-Ming Wong et al. J Biol Chem. .

Abstract

Adropin is a highly conserved polypeptide that has been suggested to act as an endocrine factor that plays important roles in metabolic regulation, insulin sensitivity, and endothelial functions. However, in this study, we provide evidence demonstrating that adropin is a plasma membrane protein expressed abundantly in the brain. Using a yeast two-hybrid screening approach, we identified NB-3/Contactin 6, a brain-specific, non-canonical, membrane-tethered Notch1 ligand, as an interaction partner of adropin. Furthermore, this interaction promotes NB3-induced activation of Notch signaling and the expression of Notch target genes. We also generated and characterized adropin knockout mice to explore the role of adropin in vivo. Adropin knockout mice exhibited decreased locomotor activity and impaired motor coordination coupled with defective synapse formation, a phenotype similar to NB-3 knockout mice. Taken together, our data suggest that adropin is a membrane-bound protein that interacts with the brain-specific Notch1 ligand NB3. It regulates physical activity and motor coordination via the NB-3/Notch signaling pathway and plays an important role in cerebellum development in mice.

Keywords: Adropin; Energy Metabolism; Locomotor Activity Motor Coordination; Membrane Protein; Molecular Cell Biology; NB-3; Notch Pathway; Yeast Two-hybrid.


Figures

FIGURE 1.
FIGURE 1.
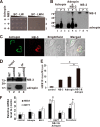
Adropin is a brain plasma membrane-bound protein. A and B, qPCR and Western blotting to check the mRNA (A) and protein (B) levels of adropin in different tissues of 8-week-old male C57BL/6N mice. In B, the arrangement of the samples is the same as in A. sWAT, subcutaneous white adipose tissue; eWAT, epididymal white adipose tissue; BAT, brown adipose tissue. C, the subcellular localization of adropin was predicted by the Phobius program. On the basis of the analysis, for the N-terminal from amino acids 1–9, because the probability of cytoplasmic is higher than the non-cytoplasmic, this region should be localized in the cytoplasm. From amino acids 9–30, the score for the transmembrane is the highest (>0.9) among all four possibilities, so this region was suggested to be the transmembrane domain. For the C-terminal from amino acids 30–76, because the probability of “non-cytoplasm” is highest, it should be localized outside of the surface of the plasma membrane. The score for the probability of the N-terminal amino acids from 1–33 as a signal peptide is lower than 0.1. D, Western blotting of adropin and adiponectin (a secretory protein used as a control) in HEK293 cells. C, cell lysate; M, culture medium; T, concentrated protein by TCA precipitation (4×) of the culture medium. E, subcellular fractionation of overexpressed adropin in HEK293 cells and endogenous adropin in mouse brain tissue. C, cytosol; Me, membrane; CM, culture medium. F–I, adropin is localized mainly on the plasma membrane. HeLa cells were grown on cover slips and transfected with a plasmid expressing adropin. After 24-h transfection, cells were fixed with 4% paraformaldehyde and stained with anti-pan-cadherin and anti-adropin antibodies. The immunofluorescence analysis was performed by confocal microscopy. Endogenous pan-cadherin (membrane marker) was visualized in red (F), adropin in green (G), and DNA in blue (H). I, colocalization of adropin and pan-cadherin was detected as yellow fluorescence.
FIGURE 2.
FIGURE 2.
Adropin can bind to NB-3 and modulate the Notch1 signaling pathway. A, validation of the interaction between NB-3 and adropin by yeast two-hybrid assay. Yeast (Y2HGold, Clontech) cells expressing both GAL-BD-adropin and GAL-AD-NB-3 could grow on the selective medium without leucine, tryptophan, and histidine (LWH) but not cells expressing either GAL-BD-adropin or GAL-AD-NB-3. SC, synthetic complete. B, validation of the interaction of NB-3 and adropin by coimmunoprecipitation. FLAG-tagged adropin and/or HA-tagged NB-3 were expressed in HEK293 cells. Immunoprecipitation was performed with anti-FLAG beads, and precipitates were immunoblotted with anti-NB-3 or anti-adropin antibody. I, input; P, pellet; S, supernatant. C, confirmation of plasma membrane colocalization of both NB-3 and adropin. HeLa cells were grown on coverslips and transfected with adropin- and NB-3-overexpressing plasmids. After 24-h transfection, cells were fixed with 4% paraformaldehyde and stained with anti-NB-3 and anti-adropin antibodies. Immunofluorescence analysis was performed by confocal microscopy. Adropin is shown in green (first panel), and NB-3was visualized in red (second panel). Colocalization of adropin and NB-3 was detected as yellow fluorescence (third panel) with bright field images to show where the cells are localized. D, validation of the interaction of endogenous adropin and NB-3 by mouse brain tissue samples. Brains from 8-week-old WT and adrKO mice were used. Coimmunoprecipitation was performed with anti-adropin antibody, and precipitates were immunoblotted with either anti-NB-3 or anti-adropin antibodies. E and F, adropin can induce the expression of Notch-regulating genes. E, HEK239 cells were transfected with the HES1 F-Luc reporter plasmid with NB-3 and/or adropin. The readings were normalized with CMV-R-Luc. The empty vector pcDNA3.1 was used, and corrected luciferase values were arbitrarily set to a value of 1 and served as a reference for comparison of fold differences. Error bars indicate mean ± S.D. of triplicate experiments. *, p < 0.05. F, qPCR was performed to check the mRNA expression levels of HES1 and HEY1 mRNA. 3T3L1 cells were transfected with NB-3- and/or adropin-overexpressing plasmid. The empty vector pcDNA3.1 was used as control and served as a reference (set to a value of 1) for comparison of fold differences. We also checked whether cocultured 3T3L1 cells transfected with NB-3- or adropin-overexpressing plasmid could induce the expression of HES1 and HEY mRNA. The γ-secretase inhibitor DAPT was used to inhibit the Notch signaling pathway. Cells were treated with 1 μm DAPT for 24 h before being harvested. Error bars indicate mean ± S.D. of triplicate experiments. *, p < 0.05 compared with control.
FIGURE 3.
FIGURE 3.
Generation and phenotypic characterization of adrKO mice. A, schematic showing adropin exon 2 of WT and adrKO mice. The open box represents exon 2 of adropin, the gray box represents the adropin ORF, the black box represents the neomycin gene, the open box with the dashed outline represents exon 20 of Dnaic1, and the black triangle represents the loxP recombination site. The horizontal arrows represent the primers for genotyping in B. B, genotyping of WT and adrKO mice by PCR. C, RT-PCR was performed to check the mRNA expression level of adropin and Dnaic1. 1 μg of total RNA samples from the brain of 8-week-old male WT and adrKO mice was used. RT-PCR demonstrated that the expression of adropin and Dnaic1 mRNAs was not affected in the brain tissues of adrKO mice. D, Western blotting of adropin protein in the brains of WT and adrKO mice. No adropin protein was detected in the brain tissue sample of adrKO mice. 100 μg of protein samples from the brains of 8-week-old male WT and adrKO mice were used. Also shown is a comparison of body weight (E), fat mass at week 24 of HFD treatment (F), glucose tolerance test (G), circulating insulin at week 20 of HFD treatment (H), and insulin tolerance test at week 24 of HFD treatment (I) between WT and adrKO mice (n = 10–12 for each group).
FIGURE 4.
FIGURE 4.
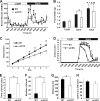
Physical activity is decreased in adrKO mice. A and B, basal locomotor activity (A) and food intake (B) of adrKO mice detected with CLAMS cages. XAMB, ambulatory movement on the x axis. C and D, the wheel running test was used to demonstrate that adrKO mice have a physical inactivity phenotype. C, accumulated running distance of WT and adrKO mice. D, average run speed for WT and adrKO mice at day 7. E–G, forced treadmill running tests measured endurance capacity. There were significant increases in time (E) and number of shocks (F) for adrKO mice compared with their WT littermates, and there was a significant reduction in total distance run by adrKO mice (G). H, hanging wire test to evaluate muscle strength. There was no significant change in the latency of fall between WT and adrKO mice (p > 0.05). Male mice at 8–12 weeks of age were used (n = 10–12 for each group). All displayed values are mean ± S.E. *, p < 0.05.
FIGURE 5.
FIGURE 5.
Impaired motor coordination and cerebellar synapse formation in adrKO mice. A, the rotarod test was used to assess motor coordination and balance. The latency time indicates how long mice were able to walk on an accelerating rotarod at speeds from 20 rpm. The adrKO mice had a motor coordination defect. The difference was more significant after the mice were given training with more than 13 trials. Male mice at 8 weeks of age were used (n = 14 per group). B, the levels of the endogenous NB-3 and Notch1 in the cerebellum of WT and adrKO mice were examined by Western blotting (left panel). Cerebellum were isolated from 8-week-old male WT or adrKO mice, followed by Western blot analysis to detect the expression levels of NB-3 and Notch1. Right panel, densitometric analysis for the relative amount of NB-3 (n = 6). *, p < 0.05. C, qPCR to determine the expression levels of HES1, HES5, Cdkn1a, and GAPDH mRNA in cerebellum of 8-week-old male WT and adrKO mice. The expression level of β-actin mRNA was used for normalization of the target gene expression levels. The corrected values of WT mice were arbitrarily set to a value of 1 (n = 5) *, p < 0.05. D, cerebellar synaptic defects in adrKO mice. Calbindin was used as a marker of Purkinje cells. VGlut1-positive puncta around Purkinje cells in adrKO and WT mice are shown. The density of the VGlut1 signal was quantified using the JACoP plugin of ImageJ (38). The corrected values of WT mice were arbitrarily set to a value of 1. There was a significant change in the density of VGlut1 puncta in adrKO mice (n = 6). *, p < 0.05.
FIGURE 6.
FIGURE 6.
Working model. A, in wild-type mice, adropin cooperates with NB-3 to regulate the Notch1 signaling pathway for normal cerebellar development. Adropin may be important for NB-3 recruitment, enrichment, and/or binding affinity to Notch1 receptor and then affects brain development, locomotor activity, and coordination. B, in adropin knockout mice, less NB-3 was recruited, and the Notch1 signaling pathway was repressed. This may affect brain development and, hence, locomotor activity and coordination.

References

    1. Kumar K. G., Trevaskis J. L., Lam D. D., Sutton G. M., Koza R. A., Chouljenko V. N., Kousoulas K. G., Rogers P. M., Kesterson R. A., Thearle M., Ferrante A. W., Jr., Mynatt R. L., Burris T. P., Dong J. Z., Halem H. A., Culler M. D., Heisler L. K., Stephens J. M., Butler A. A. (2008) Identification of adropin as a secreted factor linking dietary macronutrient intake with energy homeostasis and lipid metabolism. Cell Metab. 8, 468–481 - PMC - PubMed
    1. Ganesh Kumar K., Zhang J., Gao S., Rossi J., McGuinness O. P., Halem H. H., Culler M. D., Mynatt R. L., Butler A. A. (2012) Adropin deficiency is associated with increased adiposity and insulin resistance. Obesity 20, 1394–1402 - PMC - PubMed
    1. Lovren F., Pan Y., Quan A., Singh K. K., Shukla P. C., Gupta M., Al-Omran M., Teoh H., Verma S. (2010) Adropin is a novel regulator of endothelial function. Circulation 122, S185–S192 - PubMed
    1. Aydin S., Kuloglu T., Aydin S. (2013) Copeptin, adropin and irisin concentrations in breast milk and plasma of healthy women and those with gestational diabetes mellitus. Peptides 47, 66–70 - PubMed
    1. Butler A. A., Tam C. S., Stanhope K. L., Wolfe B. M., Ali M. R., O'Keeffe M., St-Onge M. P., Ravussin E., Havel P. J. (2012) Low circulating adropin concentrations with obesity and aging correlate with risk factors for metabolic disease and increase after gastric bypass surgery in humans. J. Clin. Endocrinol. Metab. 97, 3783–3791 - PMC - PubMed

Publication types

LinkOut - more resources