. 2014 Jul 30;9(7):e102962.
doi: 10.1371/journal.pone.0102962. eCollection 2014.

Tapping to a slow tempo in the presence of simple and complex meters reveals experience-specific biases for processing music

Affiliations

Tapping to a slow tempo in the presence of simple and complex meters reveals experience-specific biases for processing music

Sangeeta Ullal-Gupta et al. PLoS One. .

Abstract

Musical meters vary considerably across cultures, yet relatively little is known about how culture-specific experience influences metrical processing. In Experiment 1, we compared American and Indian listeners' synchronous tapping to slow sequences. Inter-tone intervals contained silence or to-be-ignored rhythms that were designed to induce a simple meter (familiar to Americans and Indians) or a complex meter (familiar only to Indians). A subset of trials contained an abrupt switch from one rhythm to another to assess the disruptive effects of contradicting the initially implied meter. In the unfilled condition, both groups tapped earlier than the target and showed large tap-tone asynchronies (measured in relative phase). When inter-tone intervals were filled with simple-meter rhythms, American listeners tapped later than targets, but their asynchronies were smaller and declined more rapidly. Likewise, asynchronies rose sharply following a switch away from simple-meter but not from complex-meter rhythm. By contrast, Indian listeners performed similarly across all rhythm types, with asynchronies rapidly declining over the course of complex- and simple-meter trials. For these listeners, a switch from either simple or complex meter increased asynchronies. Experiment 2 tested American listeners but doubled the duration of the synchronization phase prior to (and after) the switch. Here, compared with simple meters, complex-meter rhythms elicited larger asynchronies that declined at a slower rate, however, asynchronies increased after the switch for all conditions. Our results provide evidence that ease of meter processing depends to a great extent on the amount of experience with specific meters.


Conflict of interest statement

Competing Interests: The authors have declared that no competing interests exist.

Figures

Figure 1
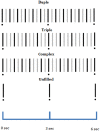
Figure 1. Schematic diagrams of two cycles of the three patterns (each cycle repeated ten times in experiment).
Dots represent the target tap location for synchronization. Vertical bars represent drum beats, with strong beats indicated in black and weak beats indicated in gray.
Figure 2
Figure 2. Schematic diagram of filled baseline and switch patterns.
“Starting drum pattern” corresponds to the rhythmic structure of the first five cycles; “Ending drum pattern” corresponds to the rhythmic structure for the last five cycles. Shaded boxes indicate sequences in which the starting rhythmic pattern is the same as the ending rhythmic pattern (filled baseline).
Figure 3
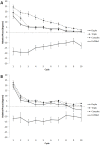
Figure 3. Mean average relative phase over course of trial for baseline sequences in Experiment 1 for Americans (A) and Indians (B).
Error bars denote between-subject standard error. Some error bars were too small to be visible.
Figure 4
Figure 4. Mean relative phase for unfilled, duple, triple, and complex baseline sequences for Americans and Indians in Experiment 1.
Error bars denote between-subject standard error.
Figure 5
Figure 5. Angular variability (MRL) for unfilled, duple, triple, and complex baseline sequences for Americans and Indians in Experiment 1.
Larger values signify lower variability. Error bars denote between-subject standard error.
Figure 6
Figure 6. Relaxation time: τ (in number of taps) for sequences starting with duple, triple and complex sequences for Americans and Indians in Experiment 1, averaged over baseline and switch trials.
Values represent an estimate of the number of cycles (taps) required for the relative phase to reach 1 degree. Error bars denote between-subject standard error.
Figure 7
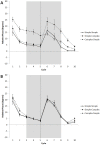
Figure 7. Mean average relative phase over course of trial for filled switch sequences for Americans (A) and Indians (B) in Experiment 1: simple-simple, simple-complex, and complex-simple conditions.
Error bars denote between-subject standard error. Some error bars were too small to be visible. Dashed line denotes point of switch. Shaded box denotes window of interest in analyses.
Figure 8
Figure 8. Mean relative phase (degrees) before and after the switch for Americans (A) and Indians (B) in Experiment 1: simple-simple, simple-complex, and complex-simple conditions.
Error bars denote between-subject standard error.
Figure 9
Figure 9. Angular variability (MRL) before and after the switch for Americans (A) and Indians (B) in Experiment 1: simple-simple, simple-complex, and complex-simple conditions.
Error bars denote between-subject standard error.
Figure 10
Figure 10. Relaxation time: τ (in number of taps) for sequences starting with duple, triple and complex sequences in Experiment 2 (Americans only).
Values represent an estimate of the number of cycles (taps) required for relative phase to reach 1 degree. Error bars denote within-subject standard error .
Figure 11
Figure 11. Mean relative phase over course of trial for filled switch sequences in Experiment 2 (Americans only): simple-simple, simple-complex, and complex-simple conditions.
Error bars denote within-subject standard error.
Figure 12
Figure 12. Mean relative phase before and after the switch in Experiment 2 (Americans only): simple-simple, simple-complex, and complex-simple conditions.
Error bars denote within-subject standard error.
Figure 13
Figure 13. Angular variability (MRL) before and after the switch in Experiment 2 (Americans only): simple-simple, simple-complex, and complex-simple conditions.
Error bars denote within-subject standard error.

References

    1. Hannon EE, Trainor LJ (2007) Music acquisition: effects of enculturation and formal training on development. Trends Cogn Sci 11: 466–472. - PubMed
    1. Kuhl PK, Tsao FM, Liu HM (2003) Foreign-language experience in infancy: Effects of short-term exposure and social interaction on phonetic learning. P Natl Acad Sci USA 100: 9096–9101. - PMC - PubMed
    1. Flege JE, Bohn OS, Jang S (1997) Effects of experience on non-native speakers' production and perception of English vowels. J Phonetics 25: 437–470.
    1. McClelland JL, Fiez JA, McCandliss BD (2002) Teaching the/r/-/l/discrimination to Japanese adults: Behavioral and neural aspects. Physiol Behav 77: 657–662. - PubMed
    1. Meissner CA, Brigham JC (2001) Thirty years of investigating the own racebias in memory for faces - A meta-analytic review. Psychol Public Pol L 7: 3–35.

Publication types

LinkOut - more resources