

The relationship between renal function and plasma concentration of the cachectic factor zinc-alpha2-glycoprotein (ZAG) in adult patients with chronic kidney disease
- PMID: 25076420
- PMCID: PMC4116200
- DOI: 10.1371/journal.pone.0103475
The relationship between renal function and plasma concentration of the cachectic factor zinc-alpha2-glycoprotein (ZAG) in adult patients with chronic kidney disease
Abstract
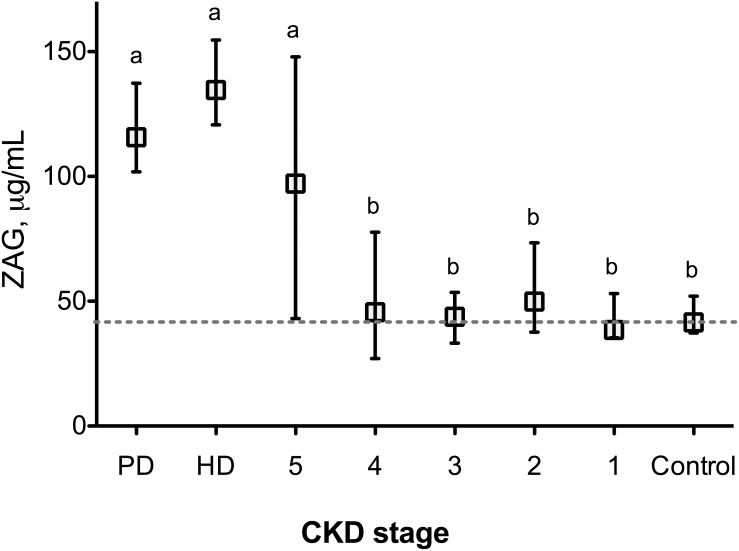
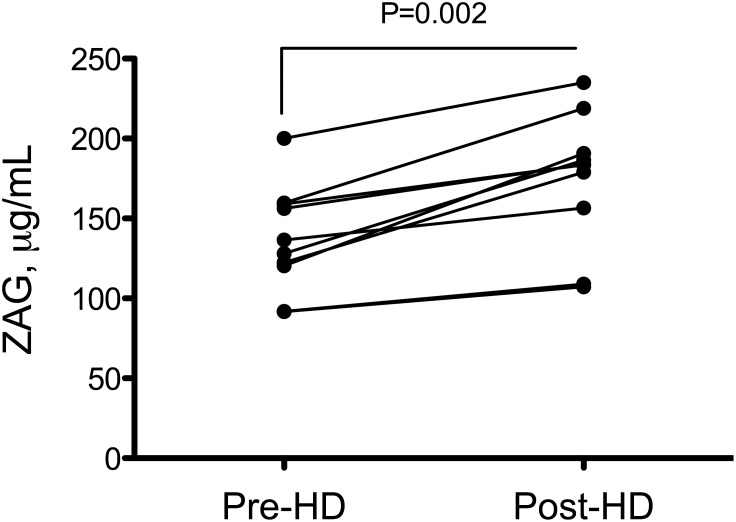
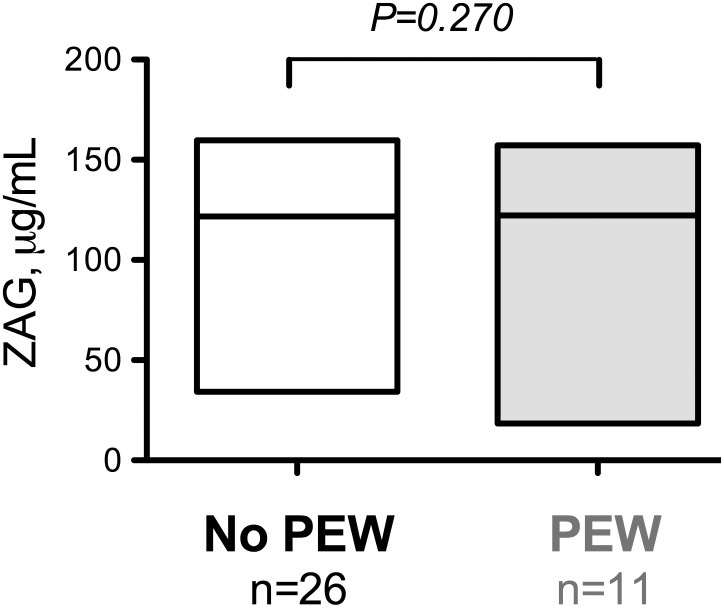
Zinc-α2-glycoprotein (ZAG), a potent cachectic factor, is increased in patients undergoing maintenance dialysis. However, there is no data for patients before initiation of renal replacement therapy. The purpose of the present study was to assess the relationship between plasma ZAG concentration and renal function in patients with a large range of glomerular filtration rate (GFR). Plasma ZAG concentration and its relationship to GFR were investigated in 71 patients with a chronic kidney disease (CKD) stage 1 to 5, 17 chronic hemodialysis (HD), 8 peritoneal dialysis (PD) and 18 non-CKD patients. Plasma ZAG concentration was 2.3-fold higher in CKD stage 5 patients and 3-fold higher in HD and PD patients compared to non-CKD controls (P<0.01). The hemodialysis session further increased plasma ZAG concentration (+39%, P<0.01). An inverse relationship was found between ZAG levels and plasma protein (rs = -0.284; P<0.01), albumin (rs = -0.282, P<0.05), hemoglobin (rs = -0.267, P<0.05) and HDL-cholesterol (rs = -0.264, P<0.05) and a positive correlation were seen with plasma urea (rs = 0.283; P<0.01). In multiple regression analyses, plasma urea and HDL-cholesterol were the only variables associated with plasma ZAG (r2 = 0.406, P<0.001). In CKD-5 patients, plasma accumulation of ZAG was not correlated with protein energy wasting. Further prospective studies are however needed to better elucidate the potential role of ZAG in end-stage renal disease.
Conflict of interest statement
Figures
References
-
- Merabet E, Dagogo-Jack S, Coyne DW, Klein S, Santiago JV, et al. (1997) Increased plasma leptin concentration in end-stage renal disease. J Clin Endocrinol Metab 82: 847–850. - PubMed
-
- Zoccali C, Mallamaci F, Tripepi G, Benedetto FA, Cutrupi S, et al. (2002) Adiponectin, metabolic risk factors, and cardiovascular events among patients with end-stage renal disease. J Am Soc Nephrol 13: 134–141. - PubMed
-
- Guebre-Egziabher F, Bernhard J, Funahashi T, Hadj-Aissa A, Fouque D (2005) Adiponectin in chronic kidney disease is related more to metabolic disturbances than to decline in renal function. Nephrol Dial Transplant 20: 129–134. - PubMed
-
- Ziegelmeier M, Bachmann A, Seeger J, Lossner U, Kratzsch J, et al. (2007) Serum levels of adipokine retinol-binding protein-4 in relation to renal function. Diabetes Care 30: 2588–2592. - PubMed
Publication types
MeSH terms
Substances
LinkOut - more resources
Full Text Sources
Other Literature Sources
Medical
Miscellaneous
