Habitat heterogeneity drives the geographical distribution of beta diversity: the case of New Zealand stream invertebrates
- PMID: 25077020
- PMCID: PMC4113293
- DOI: 10.1002/ece3.1124
Habitat heterogeneity drives the geographical distribution of beta diversity: the case of New Zealand stream invertebrates
Abstract
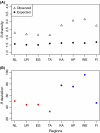
To define whether the beta diversity of stream invertebrate communities in New Zealand exhibits geographical variation unexplained by variation in gamma diversity and, if so, what mechanisms (productivity, habitat heterogeneity, dispersal limitation, disturbance) best explain the observed broad-scale beta diversity patterns. We sampled 120 streams across eight regions (stream catchments), spanning a north-south gradient of 12° of latitude, and calculated beta diversity (with both species richness and abundance data) for each region. We explored through a null model if beta diversity deviates from the expectation of stochastic assembly processes and whether the magnitude of the deviation varies geographically. We then performed multimodel inference analysis on the key environmental drivers of beta diversity, using Akaike's information criterion and model and predictor weights to select the best model(s) explaining beta diversity. Beta diversity was, unexpectedly, highest in the South Island. The null model analysis revealed that beta diversity was greater than expected by chance in all eight regions, but the magnitude of beta deviation was higher in the South Island, suggesting differences in environmental filtering and/or dispersal limitation between North and South Island. Habitat heterogeneity was the predominant driver of beta diversity of stream macroinvertebrates, with productivity having a secondary, and negative, contribution. This is one of the first studies accounting for stochastic effects while examining the ecological drivers of beta diversity. Our results suggest that local environmental heterogeneity may be the strongest determinant of beta diversity of stream invertebrates, more so than regional- or landscape-scale variables.
Keywords: Beta diversity; habitat heterogeneity; macroinvertebrates; null models; productivity; streams.
Figures


References
-
- Anderson MJ. Distance-based tests for homogeneity of multivariate dispersions. Biometrics. 2006;62:245–253. - PubMed
-
- Anderson MJ, Ellingsen KE, McArdle BH. Multivariate dispersion as a measure of beta diversity. Ecol. Lett. 2006;9:683–693. - PubMed
-
- Andrew ME, Wulder MA, Coops NC, Baillargeon G. Beta-diversity gradients of butterflies along productivity axes. Glob. Ecol. Biogeogr. 2012;21:352–364.
-
- Astorga A, Heino J, Luoto M, Muotka T. Freshwater biodiversity at a regional scale: determinants of macroinvertebrate species richness in headwater streams. Ecography. 2011;34:705–713.
-
- Astorga A, Oksanen J, Luoto M, Soininen J, Virtanen R, Muotka T. Distance decay of similarity in freshwater communities: do macro- and microorganisms follow the same rules? Glob. Ecol. Biogeogr. 2012;21:365–375.
LinkOut - more resources
Full Text Sources
Other Literature Sources
Molecular Biology Databases

